
Improving API response times when working with legacy databases is all about addressing common bottlenecks like slow queries, outdated infrastructure, and inefficient data retrieval. These systems often struggle with issues like high latency, N+1 query problems, and missing indexes, which can lead to user frustration and operational slowdowns.
Platforms like Adalo, a no-code app builder for database-driven web apps and native iOS and Android apps—one version across all three platforms, published to the Apple App Store and Google Play, offer a practical solution for teams looking to modernize their approach. By enabling developers to build modern front-ends that connect to existing database infrastructure, these tools help bridge the gap between legacy systems and contemporary user expectations.
Key Takeaways:
- Query Optimization: Use tools like
EXPLAIN ANALYZE(PostgreSQL) or slow query logs (MySQL) to identify inefficiencies. Fix N+1 query issues with eager loading and optimize joins to reduce overhead. - Indexing: Add indexes to speed up
WHERE,JOIN, andORDER BYoperations. Composite indexes can handle multi-column filtering effectively. - Caching: Tools like Redis or Memcached reduce repetitive database calls, improving response times for read-heavy APIs.
- Connection Pooling: Reuse database connections to lower latency, especially in high-concurrency setups.
- Batching: Consolidate multiple reads or writes into single transactions to save resources.
Real-World Impact:
Switching from a local SQLite database to a cloud-hosted legacy database increased query times from 500ms to 4 seconds for 200 queries. However, techniques like caching and connection pooling reduced response times by up to 96%.
Solutions in Action:
Platforms like DreamFactory can transform legacy databases into REST APIs, simplifying integration and improving performance. Pairing this with tools like Adalo lets teams build modern apps that connect seamlessly to legacy systems without overhauling the backend.
By focusing on these optimizations, you can significantly improve API performance while extending the usability of legacy databases.
REST API Performance Best Practices
Finding Performance Bottlenecks in API Integrations
Pinpointing bottlenecks is the critical first step in addressing slow response times caused by legacy databases. To improve API performance, you need to identify exactly where delays occur. Database queries follow a clear sequence: parsing, execution, and data packaging. Bottlenecks can emerge at any of these stages, but diagnosing them in legacy systems proves particularly challenging due to outdated tools that lack modern observability features.
Understanding these challenges sets the foundation for targeted optimizations that can dramatically reduce response times.
Using Profiling Tools to Analyze Performance
Most major databases include profiling tools that help uncover internal inefficiencies. Here's how to leverage them effectively:
- PostgreSQL: Use
EXPLAIN ANALYZEto view both estimated and actual execution times, enabling precise query tuning. - MySQL: Activate the slow query log to capture queries taking longer than 500ms, which helps isolate bottlenecks.
- SQL Server: The Execution Plan Viewer in SQL Server Management Studio highlights resource-heavy operations, while Azure SQL users can leverage
sys.query_store_wait_statsto monitor wait times caused by resource constraints, locking, or memory issues.
When profiling, focus on three key metrics: latency (round-trip time), throughput (requests processed in a given timeframe), and response time (total duration from request to response). Pay close attention to the ratio of rows scanned versus rows returned—a high ratio often indicates missing indexes, leading to inefficient data retrieval.
Once you've collected these metrics, the next step is eliminating redundant queries and optimizing joins for better performance.
Spotting N+1 Query Problems and Inefficient Joins
The N+1 query problem is a notorious performance drain in API integrations. It occurs when an API retrieves a list of N records and then makes N additional queries to fetch related data for each record. This issue is especially common in GraphQL implementations, where each field resolver runs a separate query, making the problem harder to detect.
To spot N+1 issues, look for patterns where a single initial query is followed by dozens—or even hundreds—of additional queries. What should be a single database round-trip can quickly spiral into a major performance bottleneck.
Join operations are another frequent source of inefficiency. To avoid problems, limit joins to three or four tables in a single query; deeper joins demand exponentially more resources. When possible, use INNER JOIN instead of LEFT JOIN, as the former is generally faster when referential integrity is guaranteed.
For read-heavy workloads with complex aggregations, consider using materialized views. These pre-compute results during off-peak times, reducing the load during high-traffic periods. Together, these strategies help tackle common challenges and improve legacy database performance.
Improving API Performance with Query Tuning and Caching
API Performance Optimization Techniques and Their Impact on Response Times
Once bottlenecks are identified, fine-tuning queries and implementing caching strategies can significantly improve API response times. Here's how to address these challenges effectively.
Fixing N+1 Queries with Eager Loading
The N+1 query problem occurs when an application makes one query to fetch a list of items and then additional queries for related data, one for each item. Eager loading solves this by retrieving all necessary data in a single database trip. Techniques like JOINs or batching (e.g., WHERE id IN (...)) can consolidate multiple queries into one.
For instance, a Laravel API improved its response time from 27.43 seconds to just 95.72ms by slashing over 4,400 queries down to 10 using eager loading and indexing.
Most modern ORMs provide built-in support for eager loading. In Laravel, you can use the with() method to preload relationships, while Django offers select_related() to efficiently load related data. The goal is to retrieve all required data upfront, avoiding repetitive queries during iteration.
Using Indexes and Filters to Reduce Query Overhead
Strategic use of indexes can reduce query execution time by 70–85%. Index columns involved in WHERE, JOIN, and ORDER BY clauses to speed up lookups. Composite indexes are particularly useful for filtering on multiple columns. Tools like EXPLAIN ANALYZE can help identify which queries would benefit most from indexing.
In addition to indexing, query projection—selecting only the columns you need instead of using SELECT *—can significantly cut down on the data processed and transferred, especially when dealing with legacy tables containing numerous columns.
Prepared statements also play a role by precompiling queries, which reduces parsing time and boosts security. Another effective tactic is batching multiple reads or writes into a single transaction, which can improve response times by as much as 45%.
These optimizations lay the groundwork for even greater performance improvements through caching and connection pooling.
Adding Caching and Connection Pooling
Caching can dramatically reduce database load, particularly for read-heavy APIs. Tools like Redis or Memcached store frequently accessed query results in memory, eliminating redundant database calls for stable data like user profiles or reference tables. To keep the cache accurate, implement invalidation logic to refresh entries whenever underlying data changes (e.g., after POST or PUT requests).
Connection pooling minimizes the overhead of creating new TCP/TLS connections for every API request. By reusing persistent connections, transaction times can drop by as much as 72%—for example, from 427ms to 118ms in high-concurrency scenarios. In one case, reusing connections in Django sped up API response times by 8–9×.
Specialized tools like HikariCP for Java or PgBouncer and ProxySQL for PostgreSQL and MySQL can help manage connection pooling efficiently. In serverless setups, reusing database clients across invocations can prevent overloading the connection pool.
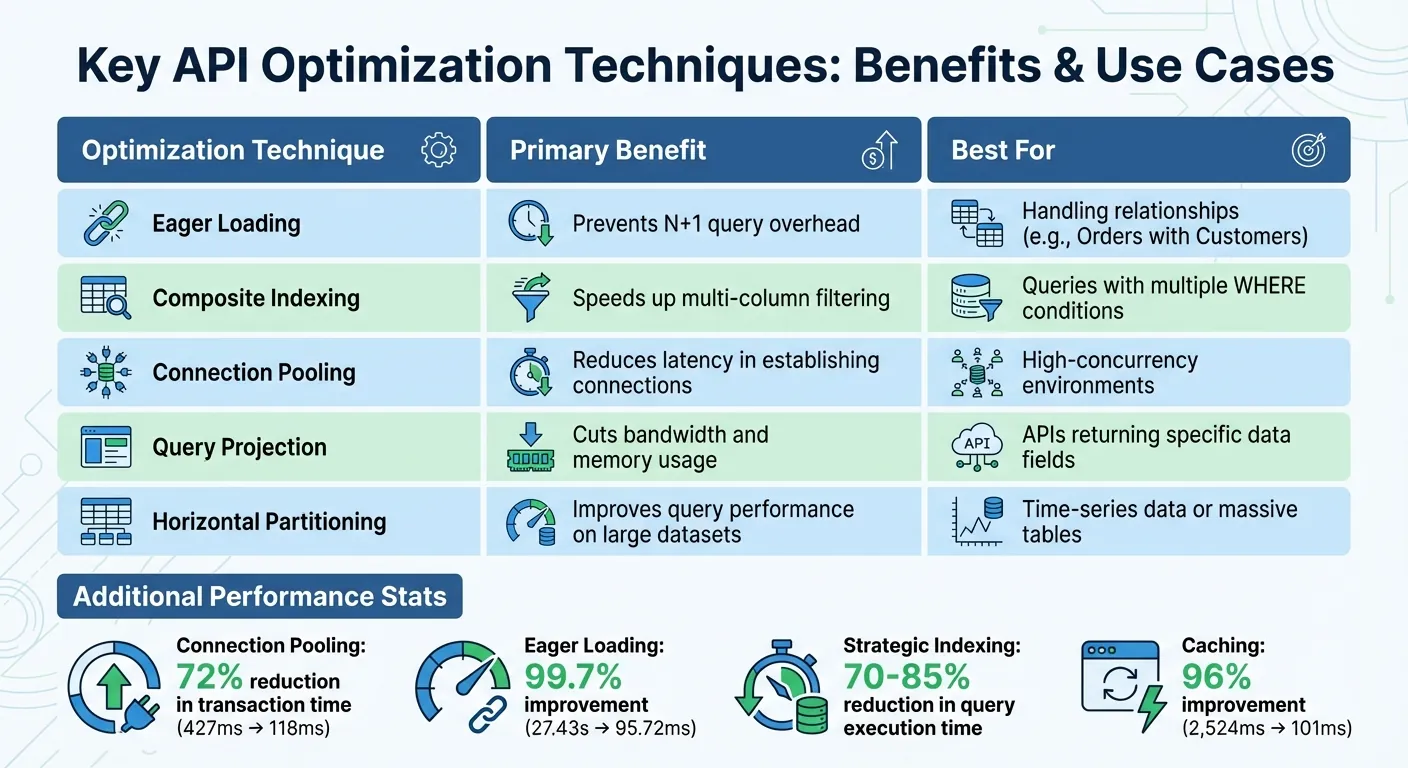
Here's a summary of key optimization techniques and their advantages:
| Optimization Technique | Primary Benefit | Best For |
|---|---|---|
| Eager Loading | Prevents N+1 query overhead | Handling relationships (e.g., Orders with Customers) |
| Composite Indexing | Speeds up multi-column filtering | Queries with multiple WHERE conditions |
| Connection Pooling | Reduces latency in establishing connections | High-concurrency environments |
| Query Projection | Cuts bandwidth and memory usage | APIs returning specific data fields |
| Horizontal Partitioning | Improves query performance on large datasets | Time-series data or massive tables |
Combining these techniques often yields the best results. For example, pairing eager loading with caching can optimize both initial data retrieval and subsequent requests, while connection pooling ensures your system can handle traffic spikes without breaking a sweat.
Using Adalo and DreamFactory for Legacy Database Integration
Using DreamFactory to Create REST APIs for Legacy Systems
DreamFactory simplifies the process of modernizing legacy systems by transforming outdated database schemas into fully documented REST APIs. It automatically generates standard endpoints—GET, POST, PUT, and DELETE—making data access more streamlined and improving query performance.
Its smart handling of relationships, including joins and subqueries, eliminates the inefficiencies caused by N+1 query issues. Features like connection pooling, filtering, and field projection help reduce the load on resource-heavy systems, ensuring smoother performance.
"Legacy databases are often so difficult to work with because they are impenetrable at first glance, with no easy way of extracting the information inside. APIs change all that by putting a kinder, gentler, more familiar face on your legacy systems." — Terence Bennett, CEO, DreamFactory
Testing on a $15 Digital Ocean Droplet with 10 MySQL requests per second demonstrated DreamFactory's efficiency: caching cut response times from 2,524 ms to just 101 ms—a 96% improvement. Additionally, companies can save an average of $45,719 per API by streamlining deployment and management.
DreamFactory offers a 14-day free trial and supports native connectors for databases like MS SQL Server, Oracle, IBM DB2, and PostgreSQL. It also includes essential features like role-based access control, SSO, JWT, and encryption, making it a robust solution for API management.
Connecting Frontend Apps with Adalo
Adalo, an AI-powered app builder, complements DreamFactory's API layer by providing the tools to build modern user interfaces for legacy data systems. By connecting directly to DreamFactory-generated APIs, Adalo enables developers to create native mobile and web applications without needing to overhaul the backend.
Ada, Adalo's AI builder, lets you describe what you want and generates your app. Magic Start creates complete app foundations from a description, while Magic Add adds features through natural language.
What sets Adalo apart is its AI Builder with Magic Start—describe what you want to build, and it generates your database structure, screens, and user flows automatically. Magic Add lets you continue building by simply describing new features you need. This AI-assisted approach means what used to take days of planning happens in minutes.
With its single-codebase approach, the platform allows simultaneous deployment to web, iOS App Store, and Android Play Store. At $36/month, Adalo offers native app store publishing with no caps on actions, users, records, or storage—predictable pricing without usage-based surprises. Compare this to alternatives like Bubble ($69/mo with Workload Units) or Thunkable ($189/mo for app store publishing), and the value becomes clear.
For enterprise users, Adalo Blue (blue.adalo.com) adds advanced features like SSO, enterprise-grade permissions, and seamless integration with systems that lack APIs—thanks to DreamFactory. The platform's modular infrastructure scales to serve apps with millions of monthly active users, processing 20 million+ daily requests with 99%+ uptime.
For instance, the National Institutes of Health modernized its grant application analytics by connecting SQL databases through DreamFactory APIs. Similarly, a major US energy company overcame integration delays between Snowflake and legacy systems using this approach.
To optimize performance, offload logic to the API layer. DreamFactory's query parameters—such as ?fields, ?related, ?limit, and ?offset—let you fetch only the data you need, retrieve nested information with a single join, and paginate results efficiently. This reduces serialization time and eliminates the need for multiple sequential calls.
This integration strategy tackles a widespread issue: 90% of IT decision-makers say legacy systems hinder their adoption of digital tools, and 88% of digital transformation leaders have seen projects fail due to legacy database challenges. By wrapping legacy databases in REST APIs and connecting them to modern app builders like Adalo, teams can create updated user-facing applications in just days or weeks—without altering the underlying infrastructure.
Conclusion: Key Strategies for Faster API Response Times
To boost API performance with legacy databases, focus on connection pooling, fixing N+1 query issues, strategic indexing, and caching. These techniques tackle connection handling, query efficiency, and data retrieval speed. Start with connection pooling, which can cut transaction times by as much as 72%. Then, address N+1 query problems using eager loading or batching, which can slash response times by 45%. Implementing strategic indexing can reduce query times by 70–85% without altering your codebase.
Caching remains a game-changer. Tools like Redis or Memcached can ease database load by 70–90% for read-heavy APIs. However, effective caching requires robust invalidation strategies to balance speed with data consistency. As Cody Lord from DreamFactory puts it:
"The fastest query is the one you don't run."
Beyond these steps, ongoing tuning is essential. As data grows, database optimizers may behave differently, so regularly reviewing execution plans with tools like EXPLAIN ANALYZE is crucial. Aim for a buffer pool hit ratio above 90% to avoid delays caused by disk reads.
For teams working with older systems, combining DreamFactory's REST API generation with Adalo's AI-assisted app building offers a practical path forward. By wrapping legacy databases in REST APIs and connecting them to modern interfaces, you can roll out updated applications in days or weeks instead of months—without touching the underlying infrastructure.
Related Blog Posts
- 8 Ways to Optimize Your No-Code App Performance
- 5 Metrics to Track No-Code App Performance
- 5 Tips To Reduce Database Query Latency
- REST APIs vs Direct DB Access for No-Code Apps
FAQ
Why choose Adalo over other app building solutions?
Adalo is an AI-powered app builder that creates true native iOS and Android apps from a single codebase. Unlike web wrappers, it compiles to native code and publishes directly to both the Apple App Store and Google Play Store. At $36/month with no caps on users, records, or storage, it offers the most predictable pricing for native app development.
What's the fastest way to build and publish an app to the App Store?
Adalo's AI Builder with Magic Start generates complete app foundations from a simple description—database structure, screens, and user flows created automatically. The drag-and-drop interface and AI-assisted building let you go from idea to published app in days. Adalo handles the complex App Store submission process, so you can focus on features instead of certificates and provisioning profiles.
Can I easily connect my legacy database to a modern mobile app?
Yes. By using tools like DreamFactory to generate REST APIs from your existing database, you can connect those APIs directly to Adalo to build polished web and mobile interfaces without overhauling your backend infrastructure. This approach lets teams modernize user-facing applications in days or weeks.
What causes slow API response times when working with legacy databases?
Slow API response times with legacy databases typically stem from N+1 query problems, missing indexes, inefficient joins, and connection overhead. High latency from repeated database calls and outdated infrastructure can cause response times to spike from milliseconds to several seconds, significantly impacting user experience.
How much can caching improve API performance?
Caching can dramatically improve API performance, reducing response times by up to 96% in some cases. Tools like Redis or Memcached store frequently accessed query results in memory, which can ease database load by 70–90% for read-heavy APIs while eliminating redundant database calls.
What is the N+1 query problem and how do I fix it?
The N+1 query problem occurs when an API makes one query to fetch a list of items, then makes additional queries for related data for each item. You can fix it using eager loading techniques that retrieve all necessary data in a single database trip, such as JOINs or batching with WHERE id IN clauses.
How does connection pooling help API performance?
Connection pooling reuses database connections instead of creating new TCP/TLS connections for every API request. This can reduce transaction times by up to 72% and is especially beneficial in high-concurrency environments where establishing new connections repeatedly creates significant overhead.
Which is more affordable, Adalo or Bubble?
Adalo is more affordable at $36/month compared to Bubble's $69/month for equivalent functionality. More importantly, Adalo offers unlimited usage with no caps on actions, users, records, or storage, while Bubble charges additional Workload Units based on CPU usage and database operations—making costs unpredictable as your app scales.
How long does it take to build an app that connects to a legacy database?
With DreamFactory generating REST APIs from your legacy database and Adalo's AI-assisted building, you can create a functional app in days rather than months. Magic Start generates your app foundation from a description, and Magic Add lets you build new features by simply describing what you need.
Do I need coding experience to connect APIs to a mobile app?
No coding experience is required. Adalo's visual interface lets you connect to external APIs through a point-and-click configuration. DreamFactory automatically generates documented REST endpoints from your database, and Adalo's drag-and-drop builder handles the frontend—no programming knowledge needed.
Build your app fast with one of our pre-made app templates
Begin Building with no codeRelated Content

Solving Performance Issues in Legacy APIs
Cut legacy API latency with caching, query tuning, API wrappers, and gradual microservices migration — practical quick wins and long-term fi

5 Tips To Reduce Database Query Latency
Cut query delays with indexing, efficient SQL, caching, partitioning, and execution-plan analysis to speed databases and reduce costs.

DreamFactory: Simplify Database API Connections
Automatically generate secure REST APIs for 20+ databases, handle RBAC, JWT, OpenAPI docs, and connect legacy systems to apps without custom

Real-Time ERP Sync with Legacy Systems
Connect legacy ERPs to modern apps with real-time sync using APIs, webhooks, or CDC to eliminate delays, reduce errors, and keep existing sy