Slow load times, crashes, and errors don't just frustrate users—they drive them away. With 85% of US users uninstalling apps due to performance issues, knowing which metrics to monitor can mean the difference between an app that thrives and one that gets deleted.
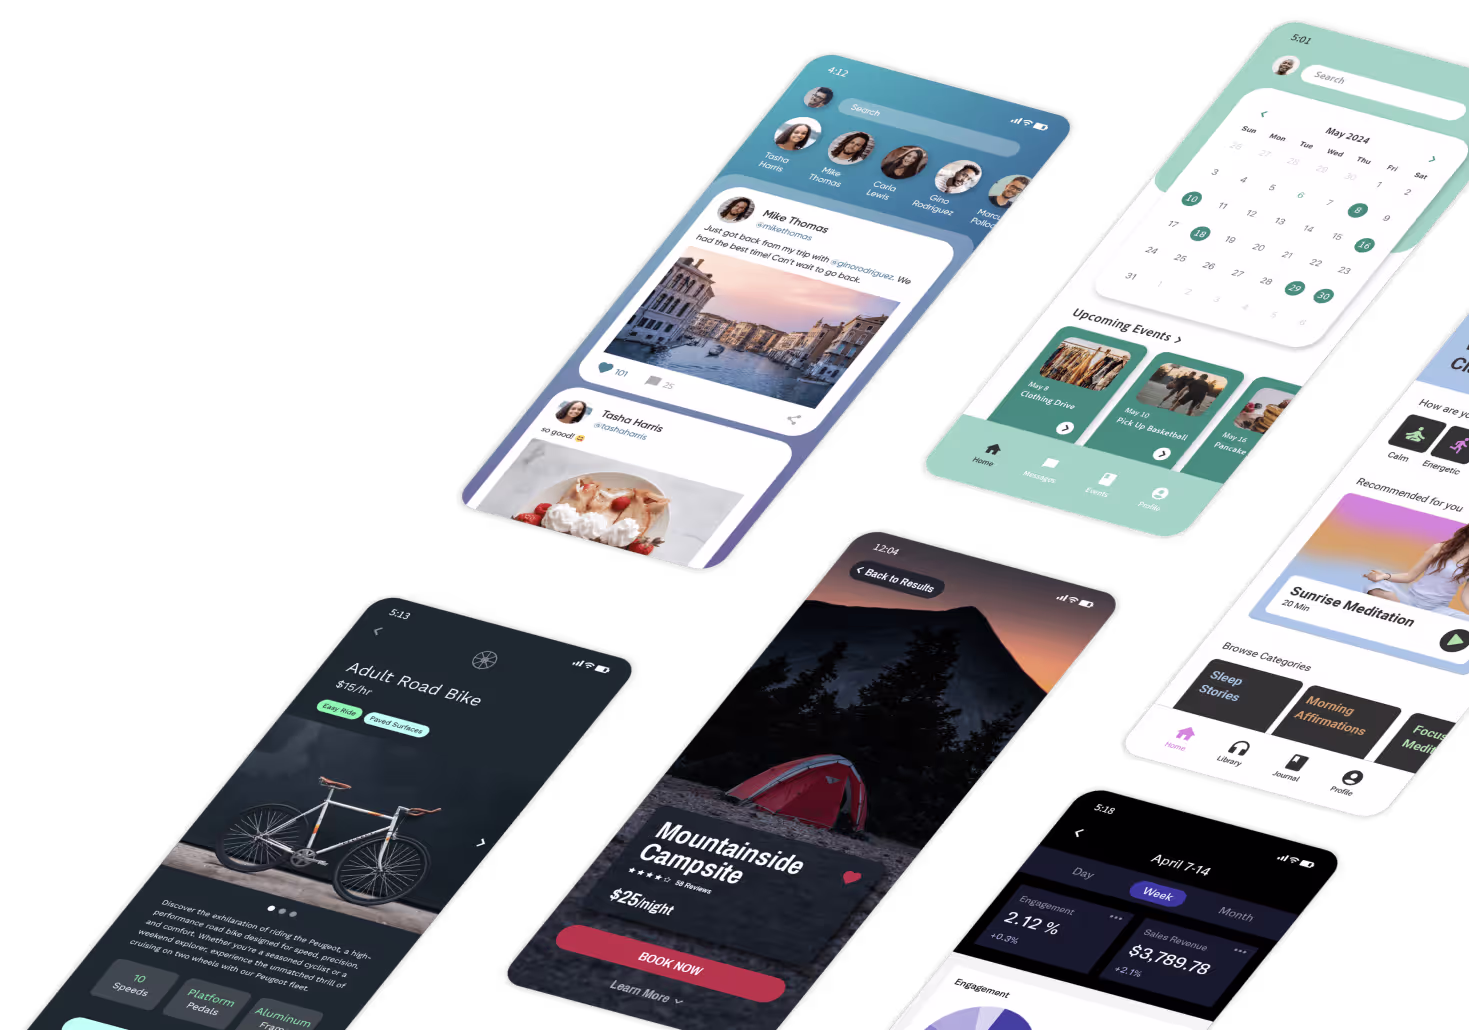
One powerful approach to staying on top of performance is building with a platform that includes built-in monitoring tools. Adalo is a no-code app builder for database-driven web apps and native iOS and Android apps—one version across all three platforms, published to the Apple App Store and Google Play. With features like X-Ray for identifying bottlenecks and real-time database tracking, Adalo helps you monitor the metrics that matter most while reaching the widest possible audience through app store distribution and push notifications.
Here are five essential metrics to track for keeping your no-code app fast, stable, and scalable.
Slow load times, crashes, and errors don't just frustrate users—they drive them away. With 85% of US users uninstalling apps due to performance issues, tracking the right metrics is essential for keeping your app competitive and your audience engaged.
Adalo, an AI-powered app builder for database-driven web apps and native iOS and Android apps, simplifies performance monitoring with built-in tools for database management and real-time tracking. One codebase publishes to web, the Apple App Store, and Google Play—handling the hardest part of launching an app. With the Adalo 3.0 infrastructure overhaul (launched late 2025), apps now run 3-4x faster with modular infrastructure that scales to your needs, meaning no record limits on paid plans.
Here are five key metrics to monitor for ensuring your app launches fast, scales effectively, and reaches the widest possible audience through app store distribution and push notifications.
Why Performance Metrics Matter for No-Code Apps
When launching an app built without traditional coding, tracking performance metrics is key to keeping users engaged and your app running smoothly. Why? Because slow load times, crashes, or errors can drive users away—85% of US users uninstall apps due to performance issues. Monitoring the right metrics helps you identify problems early and improve user experience. Here's what to focus on:
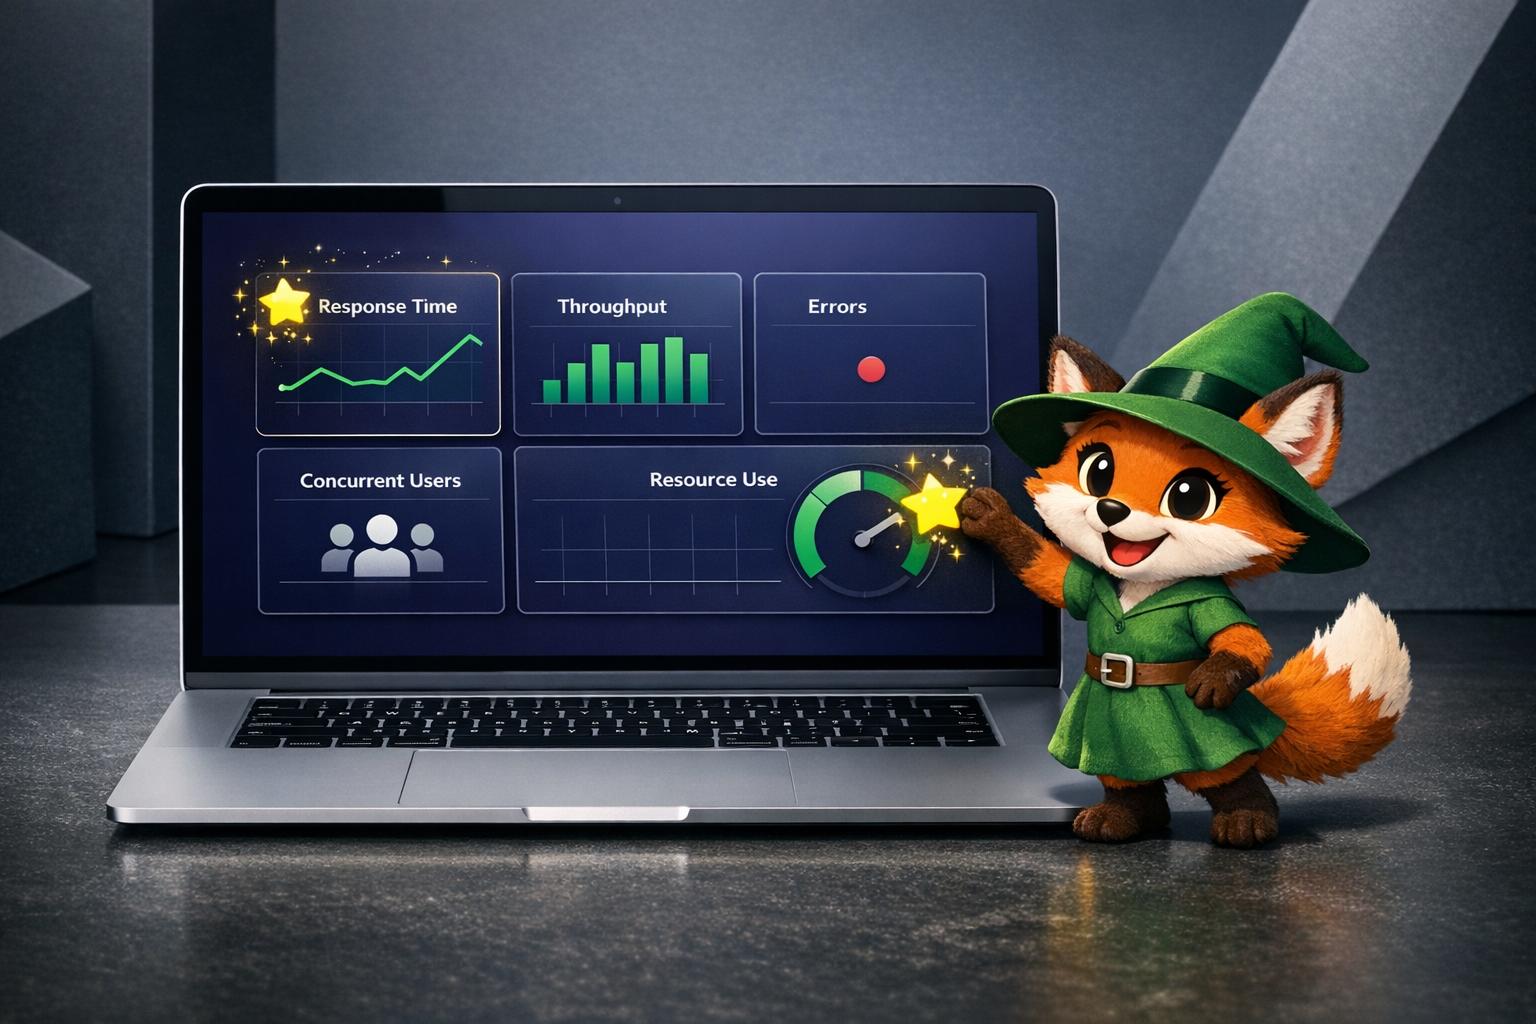
- Response Time: Apps should load in under 2 seconds and respond to user actions within 1 second. Slow performance can lead to a 26% drop in retention rates.
- Throughput: Measures how many requests your app handles per second. Consistent throughput ensures your app performs well under heavy loads.
- Error Rate: Tracks failures or crashes. Aim for a crash-free session rate of at least 98% to retain user trust.
- Concurrent Users: Monitors how many users are active at the same time. High concurrency can strain resources, slowing response times.
- Resource Utilization: Keeps tabs on CPU, memory, and bandwidth usage. Efficient management avoids lags and unnecessary costs.
Adalo is a no-code app builder for database-driven web apps and native iOS and Android apps—one version across all three platforms, published to the Apple App Store and Google Play. The platform simplifies deployment by letting you build a single app and deploy it as a PWA and natively to iOS and Android app stores without rebuilding. With tools for database management and performance monitoring—plus X-Ray, which identifies performance issues before they affect users—Adalo helps you optimize these metrics, ensuring your app scales effectively and delivers a reliable experience.
How to Build No-Code Apps + What to Consider When Adding Subscription Services
1. Response Time
Response time measures how quickly your app reacts to user actions—from the moment it loads to every tap, swipe, or data request. It's a key factor in shaping how users feel about your app and whether they stick around.
Impact on User Experience
Here's a hard truth: 88% of users abandon an app after a single bad experience. And apps with sluggish performance? They experience a 26% drop in 30-day retention rates. To keep users engaged, your app should load in under 2 seconds, respond to interactions in under 1 second, and complete critical API calls in under 200ms.
In visual app builders, response time issues often arise from database queries, complex on-screen logic (like custom formulas), and third-party integrations such as Google Maps or Zapier. Geographic distance from servers also adds network latency. The good news: these are all addressable with the right platform architecture.
Scalability Under Load
Even if your app feels snappy during initial testing, scaling up can introduce performance challenges. High API rate limits or datasets with large record counts can slow things down. To keep things running smoothly as your user base grows, you can:
- Optimize images to reduce data transfer.
- Simplify on-screen logic by breaking complex screens into smaller, more manageable ones.
- Use caching for frequently accessed data to minimize server requests.
Adalo's AI-assisted platform recently achieved an 86% reduction in initial load times for data-heavy apps through backend improvements introduced with Adalo 3.0. The platform's modular infrastructure now scales dynamically with app needs, eliminating the record caps that constrain other builders. Using techniques like skeleton loading states or progressive loading for lists can also improve perceived response times while data fetches happen in the background.
Reliability in Production Environments
Think of response time as an early warning system for your app's health. Monitoring it can help you catch performance issues—whether they stem from system load, resource allocation, or inefficient logic—before they snowball into downtime.
"Monitoring average response times enables organizations to identify performance degradation quickly."
Tracking response times by user location can highlight issues caused by network latency or poor data center placement. For example, when CPU usage exceeds 70%, response times often take a hit as the system struggles to keep up. Regular monitoring not only ensures your app meets Service Level Agreements (SLAs) but also maintains the stability users expect in production environments. Adalo's X-Ray feature helps identify these performance bottlenecks proactively, flagging issues before they impact your users.
2. Throughput
Throughput measures how many requests or transactions your app can handle within a specific time frame—often expressed as requests per second (RPS) or transactions per minute (TPM). While response time focuses on the speed of individual actions, throughput highlights the overall capacity of your system to handle work.
Scalability Under Load
High throughput is essential for scaling efficiently. Adalo processes over 20 million data requests daily across its published applications, demonstrating the level of capacity production apps must manage to remain effective. With the Adalo 3.0 infrastructure overhaul, apps now run 3-4x faster than before, with modular infrastructure that scales to support apps with over 1 million monthly active users.
Under normal conditions, throughput remains consistent. However, when resources hit their limits—such as CPU usage exceeding 70%—response times increase dramatically, and throughput declines. This drop isn't just about higher demand; it's a clear sign of resource saturation. Maintaining steady throughput under pressure is key to ensuring your app scales well while keeping response times optimized.
"Throughput reveals how much work your application can handle overall." — SigNoz
For apps built on visual platforms, throughput can be limited by database queries, complex logic, or third-party integrations. This is where platform architecture matters significantly. Platforms like Bubble use web wrappers for mobile apps, which can introduce performance constraints under load. Adalo's purpose-built native architecture maintains performance at scale, with no upper ceiling on infrastructure capacity.
Reliability in Production Environments
Tracking throughput alongside response time helps identify real performance bottlenecks versus normal traffic fluctuations. If throughput drops while response times slow, it typically points to resource constraints or database issues.
"An application with high throughput can perform and scale better compared to an application with a lower throughput." — Joydip Kanjilal, TechTarget
To avoid throughput degradation during heavy usage, streamline database operations and offload long-running tasks. With Adalo's unlimited database records on paid plans, you won't hit arbitrary data caps that force you to archive or delete records as your app grows. This removes a common scaling bottleneck that affects platforms with record limits or usage-based charges.
3. Error Rate
Error rate tracks how often your app encounters failures, expressed as a percentage of total requests or sessions. This metric is key to identifying stability issues and determining where problems originate—whether it's in database queries, visual logic, or third-party integrations like Google Maps or Zapier.
Impact on User Experience
Frequent errors can quickly harm user trust. In fact, 62% of users uninstall apps after experiencing crashes or errors. Each crash not only risks losing a user but also invites poor reviews, which can hurt your app's visibility and conversion rates.
"Every crash is a potential uninstall." — Aarzu Kedia, Plotline
Industry standards suggest crash rates should stay below 0.1%, with anything under 1% considered acceptable. On average, crash-free session rates are 99.93% for iOS and 99.81% for Android. Falling short of these benchmarks can lead to an average 26% drop in 30-day user retention. Keeping error rates in check is as critical as monitoring response times when it comes to maintaining user loyalty.
Reliability in Production Environments
To measure reliability, calculate availability using the formula: (1 - Fault Rate) × 100. This calculation is also the foundation for setting error budgets, which define how much failure is acceptable while still achieving reliability targets.
Common error sources in visual app builders include inefficient database queries (especially when handling large datasets), overly complex on-screen logic, and third-party integrations. Adalo maintains 99%+ uptime across its platform, with X-Ray helping identify potential issues before they cause errors. Tools like Firebase Crashlytics can complement this by sending automated alerts when errors exceed 2%. Aim for a crash-free rate of at least 98% to ensure a stable user experience.
It's worth noting that some third-party platform ratings and comparisons may show older performance data for various builders. Many of these assessments predate significant platform updates—for example, Adalo 3.0's complete infrastructure overhaul launched in late 2025, making pre-2026 benchmarks largely obsolete for evaluating current performance.
4. Concurrent Users
Concurrent users measure how many people are using your app at the same time. This metric is crucial because it directly influences how well your app performs under heavy use. For instance, when multiple users are querying databases, running custom formulas, or using third-party integrations like Google Maps or Zapier simultaneously, the system's capacity is tested. Keeping an eye on concurrent users helps you maintain the right balance between speed and capacity, complementing insights from other performance metrics.
Scalability Under Load
As the number of concurrent users grows, so does the strain on your infrastructure. Adalo processes over 20 million data requests daily across its platform, with modular infrastructure that scales to support apps with 1 million+ monthly active users—and no upper ceiling. This is a significant advantage over platforms that hit performance walls under load or require expensive expert consultants to optimize for scale.
When comparing platforms, architecture matters. Bubble's mobile solution uses a web wrapper approach, which can introduce latency and performance constraints as concurrent users increase. Adalo compiles to true native iOS and Android apps, maintaining performance at scale without the overhead of web-to-native translation. Additionally, Adalo's paid plans include no usage-based charges—meaning no bill shock when your app suddenly goes viral or experiences a traffic spike.
To maintain a smooth user experience, key API calls should ideally complete within 200 milliseconds. If response times exceed this threshold, delays become noticeable. As concurrency approaches the system's capacity, throughput decreases, and response times spike dramatically.
Reliability in Production Environments
High concurrent usage not only tests scalability but also highlights reliability issues. For example, when database connection pools are maxed out, response times can spike abruptly rather than slowing down gradually. Monitoring CPU usage is also critical—if it consistently exceeds 90% during peak times, it's a clear signal to scale up resources. On Android, the industry standard for ANR (Application Not Responding) events is 0.63%, but aiming for less than 0.5% is a better target.
To prepare for peak usage, track your DAU/MAU ratio (Daily Active Users divided by Monthly Active Users). This ratio helps you anticipate high-concurrency periods. Additionally, using percentile metrics like P95 or P99 during traffic surges can uncover performance issues that average response times might overlook. Implementing caching and batching API requests can significantly reduce server load during these spikes.
5. Resource Utilization
Efficient resource utilization is just as critical as response time and throughput when it comes to keeping your app running smoothly. This metric measures how much of your app's CPU, memory, disk I/O, and network bandwidth is being used. It's a key factor that influences both user experience and your monthly hosting expenses. For example, high CPU usage can significantly slow down performance.
Impact on User Experience
Poor resource management can take a serious toll on user experience. If your app spends too much time on garbage collection, it can temporarily freeze, leading to noticeable lag. High memory usage or memory leaks can hurt both performance and scalability, often causing lags or even downtime. Interestingly, about 25% of mobile apps are used only once after being downloaded, with poor performance and usability being common culprits.
This is where platform choice becomes critical. Web wrapper approaches (used by some competitors for mobile apps) add an extra layer of resource overhead—the app must run both the wrapper and the underlying web content. Adalo's native compilation means your app runs directly on the device without this additional resource burden, resulting in better battery life and smoother performance for end users.
Scalability Under Load
Every database query and integration eats up resources, and if these processes aren't optimized, they can drag down performance. For instance, CPU usage exceeding 90% is a red flag for system strain. Similarly, memory usage above 85% demands immediate attention to avoid OutOfMemory errors. Resource limitations can also vary across devices, adding another layer of complexity.
By fine-tuning resource usage, you not only enhance performance but also keep operational costs in check. Adalo's approach removes a common resource concern: unlimited database records on paid plans means you don't need to implement complex archiving strategies or worry about hitting data caps that force you to upgrade or delete records.
Cost-Efficiency of Resource Usage
Managing resources efficiently is essential for scaling your app without sacrificing user experience. Keeping an eye on resource consumption can help you avoid unnecessary spending on infrastructure. While cloud auto-scaling can mask inefficiencies, it often leads to higher hosting bills. Striving for availability beyond 99.9%, such as 99.99%, can significantly drive up costs and complexity. For many applications, 99.9% availability strikes a practical balance between reliability and cost.
Platform pricing models significantly impact cost efficiency. Bubble's plans start at $59/month with usage-based Workload Unit charges that can be difficult to predict—many users report bill shock when their apps gain traction. Adalo starts at $36/month with unlimited usage and no usage-based charges, making costs predictable as you scale. To save resources and reduce expenses, consider optimizing database queries and simplifying on-screen logic.
Adalo comes equipped with real-time monitoring tools and X-Ray performance analysis, making it easier to track resource metrics and ensure your app remains both high-performing and cost-efficient.
Comparing Platform Approaches to Performance
Not all app builders handle performance the same way. Understanding the architectural differences helps you choose the right platform for your scaling needs.
| Platform | Starting Price | Database Limits | Mobile App Type | Usage Charges |
|---|---|---|---|---|
| Adalo | $36/month | Unlimited on paid plans | True native iOS/Android | None |
| Bubble | $59/month | Limited by Workload Units | Web wrapper | Workload-based |
| Glide | $60/month | Row limits apply | No App Store publishing | Data row charges |
| FlutterFlow | $70/month per user | External DB required | Native (low-code) | Varies by DB choice |
Bubble offers more customization options, but this flexibility often results in slower applications that suffer under increased load. Many Bubble users end up hiring experts to optimize performance—claims of millions of MAU are typically only achievable with significant expert assistance and ongoing optimization work. Bubble's mobile solution uses a web wrapper, meaning updates don't automatically sync across web, Android, and iOS deployments.
FlutterFlow targets technical users with a low-code approach, but requires you to set up and manage your own external database. This adds significant learning complexity, and suboptimal database setup can create scaling problems. Their ecosystem is rich with consultants precisely because so many users need help achieving scalability.
Glide excels at spreadsheet-based apps with template-driven development, but this creates generic apps with limited creative freedom. Glide doesn't support Apple App Store or Google Play Store publishing, limiting your distribution options.
Adalo's approach—true native compilation, unlimited data storage, and no usage charges—provides predictable performance and costs as you scale. With over 3 million apps created on the platform, the visual builder has been described as "easy as PowerPoint," while the AI features Builder (early 2026) promises even faster creation through natural language prompts.
Conclusion
Taking a closer look at these key performance metrics, it's evident that keeping track of them is crucial for ensuring your app runs smoothly and adapts as it grows. Each metric has its own role to play: response time and throughput directly impact how users experience the app, while error rates and concurrent user capacity ensure stability under pressure. Meanwhile, resource utilization helps you strike the right balance between performance and cost-efficiency.
Every tweak you make to your app's logic or data structure can ripple through its overall performance. As the Adalo Team aptly explains:
"We encourage you to think about mobile app performance in similar terms [to GTMetrix], and regularly ponder how a particular application change or addition will affect performance."
Adopting this proactive mindset allows you to spot potential issues early and keep your app running seamlessly—delivering the kind of experience that keeps users coming back. By continuously monitoring these metrics, you're not just optimizing performance; you're also setting your app up to scale effectively.
The platform you choose matters significantly for long-term performance. Adalo takes care of the heavy lifting when it comes to backend infrastructure—like database management, server upkeep, and progressive loading—so you can focus on refining the user experience. The Adalo 3.0 infrastructure overhaul delivered 3-4x faster performance, and tools like X-Ray help identify bottlenecks before they affect users. With no record limits on paid plans and no usage-based charges, you can scale confidently without worrying about surprise costs or arbitrary data caps.
Related Blog Posts
- 5 Steps to Monetize Your No-Code Mobile Application
- 8 Ways to Optimize Your No-Code App Performance
- Ultimate Guide to No-Code MVP Prototyping
- How To Enable Employees To Build The Apps They Need
FAQ
Why choose Adalo over other app building solutions?
Adalo is an AI-powered app builder that creates true native iOS and Android apps from a single codebase. Unlike web wrappers, it compiles to native code and publishes directly to both the Apple App Store and Google Play Store—handling the hardest part of launching an app. With unlimited database records on paid plans and no usage-based charges, you get predictable costs as you scale.
What's the fastest way to build and publish an app to the App Store?
Ada, Adalo's AI builder, lets you describe what you want and generates your app. Magic Start creates complete app foundations from a description, while Magic Add adds features through natural language.
Adalo's drag-and-drop interface and AI-assisted building let you go from idea to published app in days rather than months. Magic Start generates complete app foundations from descriptions, and the platform handles the complex App Store submission process—certificates, provisioning profiles, and store guidelines—so you can focus on features instead of technical requirements.
Which is more affordable, Adalo or Bubble?
Adalo starts at $36/month with unlimited usage and no usage-based charges. Bubble starts at $59/month with Workload Unit charges that can be difficult to predict, often leading to bill shock when apps gain traction. Adalo's pricing is more predictable for scaling apps.
Which is faster to build with, Adalo or Bubble?
Adalo's visual builder has been described as "easy as PowerPoint," with Magic Start generating complete app foundations from simple descriptions. Bubble offers more customization but has a steeper learning curve. For getting to a working app quickly, Adalo typically requires less time.
Is Adalo better than Bubble for mobile apps?
For native mobile apps, yes. Adalo compiles to true native iOS and Android code, while Bubble uses a web wrapper approach for mobile. Native apps perform better, use fewer device resources, and provide a smoother user experience—especially important as concurrent users increase.
What is a good response time for an app?
A well-performing app should load in under 2 seconds, respond to user interactions within 1 second, and complete critical API calls in under 200 milliseconds. Slow response times can lead to a 26% drop in 30-day retention rates, making this metric crucial for user engagement.
What error rate should I aim for in my app?
Industry standards recommend keeping crash rates below 0.1%, with anything under 1% considered acceptable. Aim for a crash-free session rate of at least 98% to maintain user trust, as 62% of users uninstall apps after experiencing crashes or errors.
How can I improve my app's performance under heavy load?
Optimize images to reduce data transfer, simplify on-screen logic by breaking complex screens into smaller ones, and use caching for frequently accessed data. Monitor CPU usage and keep it below 90% to prevent performance degradation. Adalo's X-Ray feature helps identify bottlenecks before they affect users.
Why is monitoring concurrent users important?
Monitoring concurrent users helps you understand how your app performs when multiple people use it simultaneously. High concurrency can strain database queries, API rate limits, and server resources, leading to slower response times or errors. Tracking this metric helps you anticipate peak usage and scale resources accordingly.
Can I migrate from Bubble to Adalo?
Yes, you can rebuild your app in Adalo. While there's no automatic migration tool, Adalo's visual builder and Magic Start make it straightforward to recreate your app's functionality. Many users migrate to gain true native mobile apps, predictable pricing without usage charges, and unlimited database records.