Why Adalo Works for Building a Cisco Hardware Monitoring App
Adalo is a no-code app builder for database-driven web apps and native iOS and Android apps—one version across all three platforms, published to the Apple App Store and Google Play. This makes it particularly well-suited for creating a Cisco hardware monitoring solution, where network administrators need to track device metrics from their desks, on the go, or across distributed IT teams—all from a single application.
Having your monitoring app available on mobile devices means you can receive push notifications when a switch goes down or a server's CPU spikes, allowing for immediate response even when you're away from your workstation. With Adalo's database-driven architecture, you can store historical metrics, set custom alert thresholds, and give your entire IT team real-time visibility into your Cisco infrastructure without the complexity of traditional enterprise monitoring platforms.
Why Adalo Works for Building a Cisco Hardware Monitoring App
Network administrators managing Cisco infrastructure face a persistent challenge: monitoring servers, switches, and routers requires either expensive enterprise solutions or custom development that takes months and costs six figures. The gap between what IT teams need and what they can realistically build has kept many organizations stuck with fragmented monitoring tools or spreadsheet-based tracking.
Adalo, an AI-powered app builder, closes this gap by enabling you to create a fully functional Cisco hardware monitoring app without writing code. Instead of managing complex scripts or time-series databases, you can build an app that tracks CPU usage, memory utilization, temperature, and device availability—then deploy it to web, iOS, and Android from a single codebase. Here's how to get started:
-
Set Up Cisco Data Access:
- Use SNMP (Simple Network Management Protocol) to pull metrics from Cisco devices.
- Choose between SNMPv2c (easier setup) or SNMPv3 (better security).
- Alternatively, access data via Cisco Business Dashboard APIs using JSON Web Tokens (JWT).
-
Prepare Your Adalo Workspace:
- Sign up at adalo.com and explore its visual app builder.
- Organize your data into collections like Devices, Metrics, and Alerts.
-
Connect Cisco Devices:
- Enable SNMP on your devices to share performance data.
- Use DreamFactory to convert SNMP data into REST APIs compatible with Adalo.
-
Build Dashboards:
- Design intuitive dashboards with charts and tables to visualize trends.
- Customize screens for different user roles (e.g., admins vs. managers).
-
Set Up Alerts:
- Define thresholds (e.g., CPU > 90%) to trigger notifications.
- Use Adalo's Notifications API to send real-time alerts.
-
Test and Publish:
- Validate data connections and functionality.
- Deploy your app to web, iOS, and Android platforms without rebuilding for each.
The platform handles the complexity of native app compilation and app store submission, letting you focus on designing the monitoring experience your team actually needs.

6-Step Process to Build a Cisco Hardware Monitoring App with Adalo
What You Need Before You Start
Before diving into building your app, make sure you have access to your Cisco device data and have set up your Adalo account.
Access to Cisco Hardware Data
Cisco devices come equipped with built-in tools to share performance data, but you'll need to enable these features first. One of the most common methods is SNMP (Simple Network Management Protocol), which is supported by all Cisco devices. SNMP allows you to query specific metrics—like CPU usage, memory utilization, temperature, and network traffic—by accessing Object Identifiers (OIDs) stored in a Management Information Base (MIB).
When using SNMP, you'll need to choose between SNMPv2c and SNMPv3:
- SNMPv2c: Easier to set up and only requires a community string (default is often "public" for read-only access), but it lacks robust security.
- SNMPv3: Offers better security features, including message integrity, authentication, and encryption, making it the preferred choice for production environments. To configure SNMPv3, you'll need:
- A username
- An authentication protocol (e.g., HMAC-SHA)
- A privacy protocol (e.g., CFB-AES-128)
Regardless of the version you choose, make sure to replace default community strings like "public" or "private" with custom ones. Also, apply IP-based access restrictions to enhance security.
For more advanced setups, or if you're using Cisco Business Dashboard, you can access device data via APIs. To do this, generate an access key from the Dashboard's administration interface. Navigate to "My Profile" or "Administration > Users", and click "Generate Access Key" to receive an ID and secret. Be sure to save the secret immediately, as it will only be displayed once. API requests are authenticated using JSON Web Tokens (JWT) signed with this secret.
Here are some key metrics to monitor from your Cisco devices:
| Metric Type | OID | Description |
|---|---|---|
| Overall CPU Usage (%) | 1.3.6.1.4.1.14179.1.1.5.1.0 | Current CPU utilization |
| 5-Minute CPU Average | 1.3.6.1.4.1.9.9.109.1.1.1.1.8 | Use for trend monitoring (threshold: 90%) |
| RAM Usage (%) | 1.3.6.1.4.1.9.9.618.1.8.6.0 | Memory pool utilization |
| Temperature (°C) | 1.3.6.1.4.1.14179.2.3.1.13.0 | Environmental sensor reading |
Important Note: Avoid polling devices too frequently. Running SNMP queries every second can spike CPU usage to 99%, as responding to these requests creates significant overhead. Instead, use 5-minute averages for better trend analysis and capacity planning.
Once your Cisco data streams are configured and secure, the next step is setting up your Adalo workspace.
Setting Up Your Adalo Account
Visit adalo.com to sign up for an account. Adalo offers a free plan for building and publishing web apps, as well as a free trial with access to premium features for testing app store deployments. Paid plans start at $36/month and include unlimited database records with no usage-based charges—a significant advantage for monitoring apps that accumulate large volumes of metric data over time.
Ada, Adalo's AI builder, lets you describe what you want and generates your app. Magic Start creates complete app foundations from a description, while Magic Add adds features through natural language.
After signing up, you'll be taken to Adalo's visual app builder interface. Users frequently describe the experience as "as easy as PowerPoint"—you'll design dashboards, set up databases to store metrics, and configure alerts using drag-and-drop components. The platform's Magic Start feature can generate complete app foundations from a simple description, accelerating your initial setup significantly.
To get comfortable with the interface, try creating a simple test screen. This hands-on practice will make the later steps much smoother. With your Cisco data and Adalo account ready, you're all set to start connecting your devices and building your app.
Step 1: Connect to Your Cisco Devices
With your Cisco devices and Adalo account set up, the next step is to connect your Cisco hardware to your app. This involves two key tasks: enabling SNMP on your Cisco devices to share performance data and using DreamFactory to convert that data into a REST API that Adalo can utilize.
Enable SNMP on Cisco Devices
To gather performance metrics from your Cisco servers and switches, start by accessing your device through SSH or Telnet. Once logged in, enter enable mode and run configure terminal to switch to global configuration.
Set up a read-only community string, such as snmp-server community CiscoMonitor2026 RO. The "read-only" setting ensures your app can retrieve data without risking changes to device configurations. Avoid default strings like "public" or "private"—opt for unique and complex names to enhance security.
After completing the SNMP configuration, verify it by running:
show running-configor
show snmpIf you see an error like "%SNMP agent not enabled", the setup didn't apply correctly. Once confirmed, save the configuration using a command like write memory.
For environments requiring stronger security, switch to SNMPv3 instead of SNMPv2c. SNMPv3 adds features like message integrity, authentication (e.g., HMAC-SHA), and encryption (e.g., CFB-AES-128). Additionally, restrict SNMP queries to specific IPs and netmasks to prevent unauthorized access.
Performance Tip: Avoid polling devices too often. Querying SNMP variables every second can push CPU usage to 99%. Instead, use the 5-minute CPU average OID (1.3.6.1.4.1.9.9.109.1.1.1.1.8) for stable trend monitoring, and keep the baseline threshold at 90%.
Generate APIs with DreamFactory
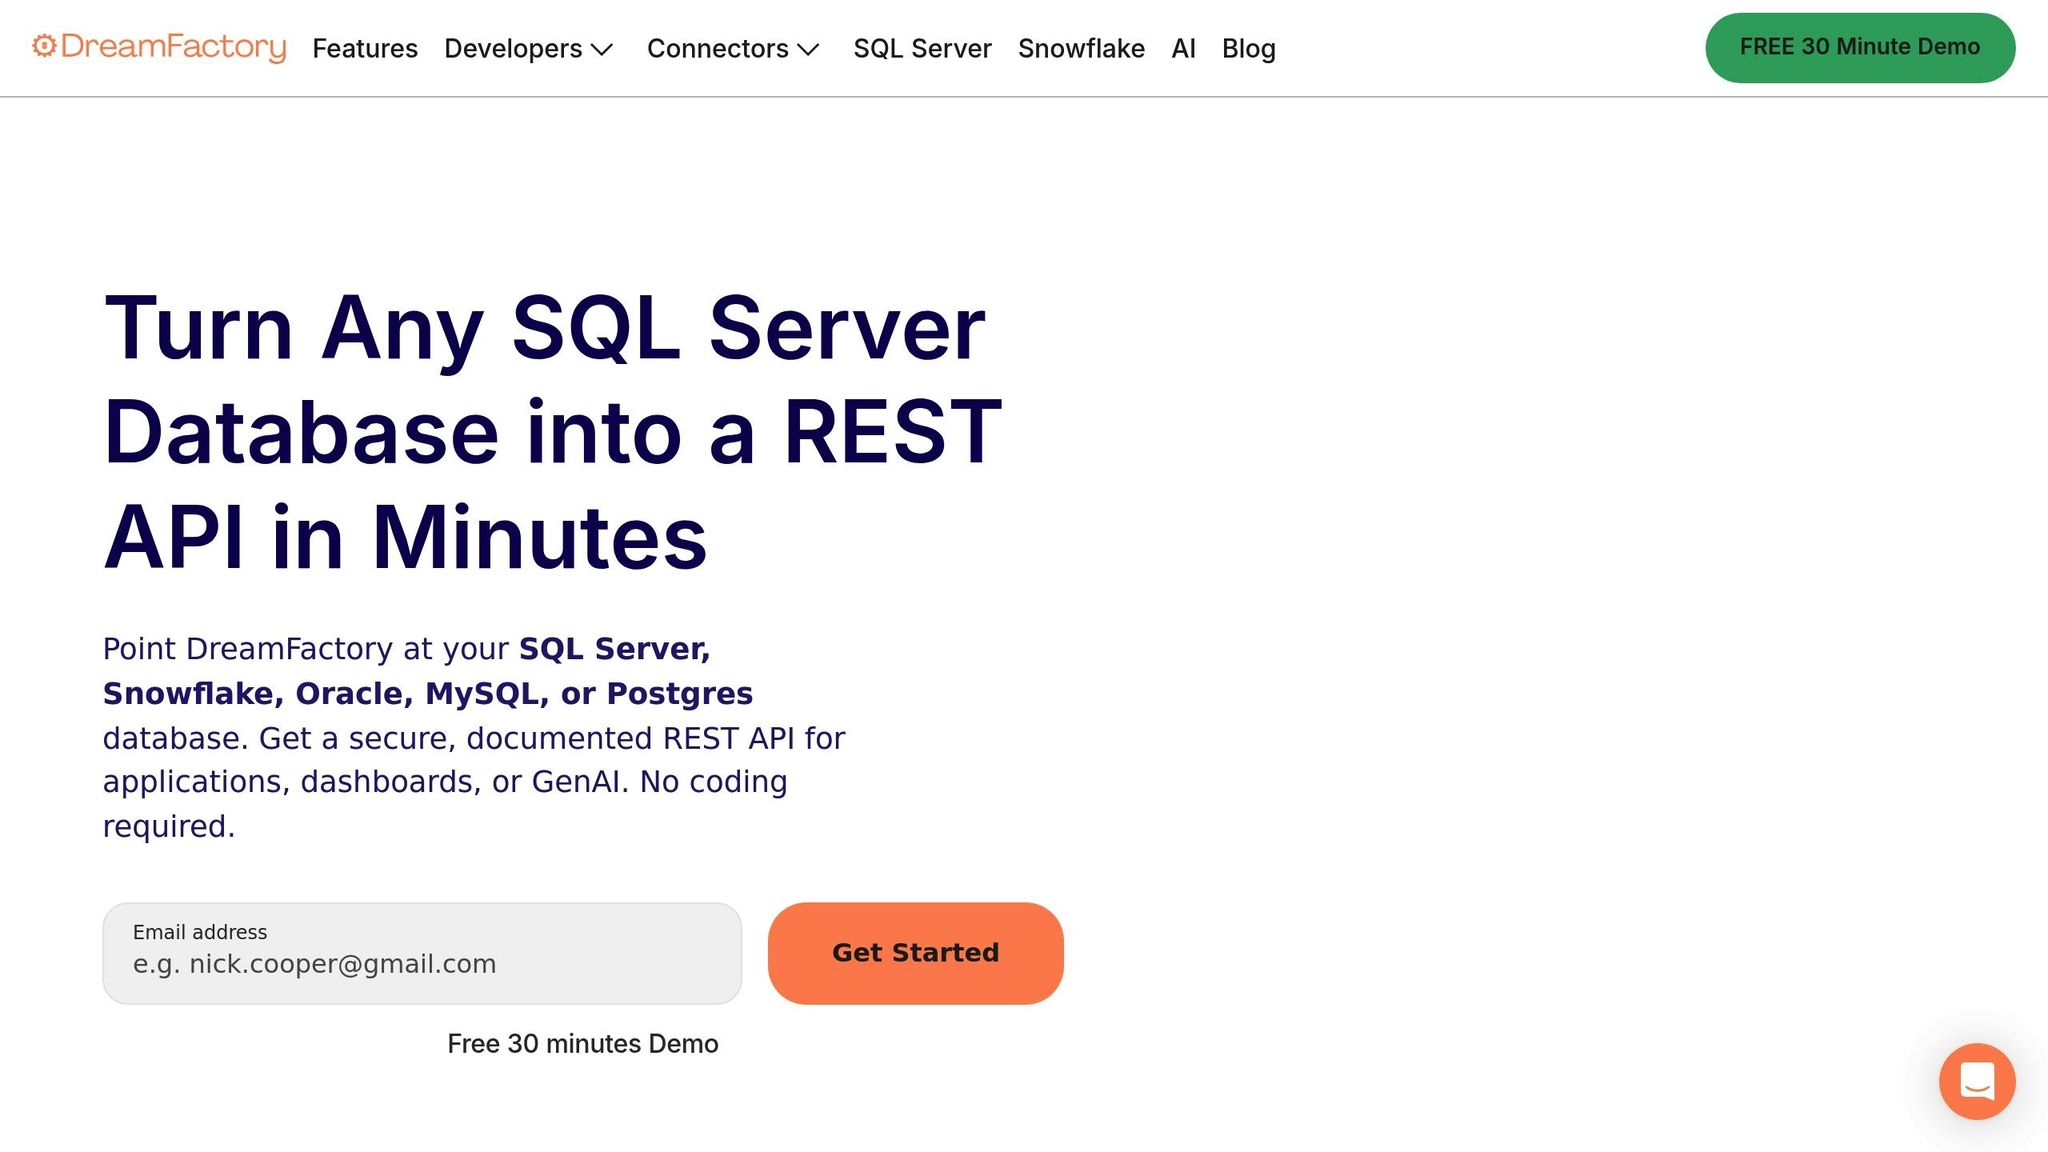
Since Cisco devices don't come with a built-in REST API, DreamFactory bridges the gap. DreamFactory is an open-source platform that converts your device data into REST APIs, making it compatible with Adalo's External Collections feature. It processes data—typically stored in a database after SNMP polling—and wraps it in a RESTful interface.
"DreamFactory is an open-source REST API platform that automatically generates secure, fully documented APIs for any data source in minutes... eliminating the need to write backend code."
— DreamFactory Documentation
To begin, set up a DreamFactory instance (either self-hosted or cloud-based) and connect it to the database storing your Cisco metrics. DreamFactory works with databases like MySQL, PostgreSQL, and SQL Server, instantly creating a suite of REST APIs with full CRUD functionality, so you don't have to write backend code.
For security, use DreamFactory's role-based access control (RBAC) and API key management. Create a role limited to accessing your Cisco monitoring tables. When linking DreamFactory to Adalo, you'll need the API Base URL and an API Key. Adalo uses the key in the X-DreamFactory-API-Key header for every request. A key setup detail: set the "Results Key" in Adalo to "resource", as DreamFactory returns data collections under this JSON key.
Before connecting to Adalo, test your endpoints using DreamFactory's auto-generated Swagger documentation. For metrics that don't change often, like 5-minute CPU averages, enable caching in DreamFactory to boost performance and reduce database load.
With your Cisco data now accessible via REST APIs, you're ready to move on to building your app in Step 2.
Step 2: Build Your App Structure and Database
Now that your Cisco data is accessible through DreamFactory's REST APIs, it's time to structure your Adalo app. This involves setting up database collections and leveraging AI tools to create a monitoring layout tailored to your needs.
Create Database Collections
Adalo organizes data into Collections, Properties, and Records, which makes it easy to manage and display information. For monitoring Cisco hardware, start by creating three main collections: Devices, Metrics, and Alerts.
- Devices Collection: This serves as your hardware inventory. Add properties like Device Name, IP Address, Model, Serial Number, and Status. Use Text properties for names and IP addresses, and a True/False property for "Is Online" to quickly identify connectivity issues. Set the primary property (e.g., Device Name) to make devices easily identifiable in the app.
- Metrics Collection: Track performance data over time here. Add Number properties for CPU Load (%), Memory Usage (in MB), Temperature (in °F for U.S. deployments), and Uptime (in seconds). Include a Date/Time property to timestamp each reading, which is essential for spotting trends or troubleshooting issues. Adalo's number properties can handle up to 15 digits, allowing for custom formulas and detailed charting.
- Alerts Collection: Use this to log critical events. Add Text properties for Alert Message and Severity Level (e.g., "Critical", "Warning", or "Info"). Include a True/False property for "Resolved" to track whether an issue has been addressed. Use a Relationship property to link each alert back to its corresponding device.
To ensure seamless data relationships, use Adalo's One-to-Many feature. Link the Devices collection to both Metrics and Alerts, so each Cisco device can have multiple performance records and alert logs over time.
Alternatively, you can use External Collections to connect directly to DreamFactory. Simply enter the Base URL, Authorization headers, and set the Results Key to "resource." Note that this feature is available with Adalo's Professional, Team, or Business plans.
A key advantage for monitoring applications: paid Adalo plans have no database record limits. This matters significantly for Cisco monitoring apps that accumulate thousands of metric readings daily. Unlike platforms that cap records or charge based on data volume, Adalo's infrastructure scales with your monitoring needs without unexpected costs.
| Property Type | Example Use Cases for Cisco Monitoring |
|---|---|
| Number | CPU Load (%), Memory Usage (MB), Temperature (°F), Uptime (seconds) |
| Text | Device Name, Model, IP Address, Alert Message, Severity Level |
| Date/Time | Timestamp for metrics or alert triggers |
| Relationship | Link Alerts or Metrics to specific Cisco Devices |
| True/False | Indicators like "Is Online" or "Port Active" |
Use AI Tools to Generate Your App Layout
Kickstart your project with Adalo's Magic Start feature, which generates an app layout based on a brief description. Enter something like "Cisco Hardware Monitoring Dashboard with real-time CPU and memory tracking", and the AI creates collections such as Devices, Metrics, and Alerts, along with basic screens. What used to take days of planning happens in minutes. You can then refine property names and types to better match your specific requirements.
Once your foundation is in place, use Magic Add to expand functionality through natural language requests. Describe what you want—"add a screen showing devices with critical alerts"—and the feature generates the appropriate components. This AI-assisted approach accelerates development while maintaining full control over the final design.
To enhance the visual appeal and functionality of your app, explore the Marketplace for data visualization components. Search for "Charts and Graphs" and drag elements like bar or line charts onto your screens. These visual tools are perfect for displaying trends such as CPU load or memory usage over time.
Use the Preview App button frequently to test how your layout performs across various devices, such as tablets or desktop browsers—common platforms for monitoring dashboards. You can also customize the app's appearance using the Branding button to match your organization's colors or Cisco's iconic blue-and-white theme.
Once your app structure and layout are in place, you'll be ready to move on to designing detailed monitoring dashboards in Step 3.
Step 3: Design Your Monitoring Dashboards
Now that your data connections and app structure are in place, it's time to bring your Cisco metrics to life with a well-designed dashboard. To make this happen, your dashboard should include three key components: the Frontend (visual elements like charts and graphs), the Backend (logic to process and transform data), and the Database (for storing or retrieving Cisco metrics). The aim is simple—present the right data, at the right time, in a format that's easy to understand and act on.
Add Charts and Tables for Metrics
Visualizing hardware performance is crucial, and clear charts and tables can help you communicate this effectively. Adalo's marketplace offers pre-built components for displaying metrics like bandwidth, uptime, and hardware health. For data like CPU load, temperature (°F), and PoE consumption, use line charts or area graphs to display trends over time. These visualizations can help identify performance issues before they escalate into outages. Make sure to link these charts to the Date/Time property in your Metrics collection.
For tracking device inventory and status, use a Simple List or Table component and connect it to the getNodes API method from the Cisco Business Dashboard. This API provides a JSON list containing details like hostname, IP address, model, and online status. To keep things organized, apply sorting parameters (e.g., sort=ip,asc) and enable paging (e.g., size=20) to ensure smooth performance, even with large networks.
Add status indicators like colored icons or cards to show device statuses. These can be tied to the system-state.online boolean property, with colors like green for "Online", red for "Critical", and yellow for "Warning". You can customize these colors using the Branding button (artist's palette icon). For environmental metrics, such as temperature or humidity from Meraki MT sensors, use gauge charts, while bar graphs work well for tracking PoE energy usage from Catalyst switches.
| Cisco Metric Category | Recommended Adalo Component | Data Source Example |
|---|---|---|
| Device Inventory | Simple List / Table | getNodes API (Hostname, IP, Model) |
| Hardware Health | Line Chart / Bar Graph | DOM Telemetry or PoE Port Usage |
| Connection Status | Status Indicator (Icon) | system-state.online boolean |
| Alert Severity | Colored List / Cards | Alert Rules (Critical, Major, Minor) |
| Environmental Data | Gauge / Chart | Meraki MT Temperature/Humidity sensors |
Customize Dashboards for Different Users
To ensure your dashboards meet the needs of various users, tailor them to specific roles. Network administrators often require detailed, real-time metrics like per-port power consumption or Digital Optical Monitoring (DOM) telemetry. IT managers might prefer high-level graphs that highlight historical trends.
In Adalo, create separate screens for each role, such as an "Admin Overview" and a "Manager Summary." Link these screens to user profiles based on their login credentials. Add properties like "Organization ID" or "Device Type" (e.g., Switch, Router) to your Devices collection, and use filters to display relevant data on each screen. For multi-site setups, include the x-ctx-org-id header in your API calls to focus on specific organizations or locations. Additionally, allow IT managers to filter out routine Minor alerts, focusing instead on Critical or Major issues.
Use conditional visibility to control what each user sees. Administrators managing power budgets can view PoE usage graphs, while managers might see regional performance summaries filtered by Organization Hierarchy. Test these tailored views using the Preview App button on tablets or desktop browsers, adjusting layouts as needed. The Version History feature allows you to save up to 10 versions of your dashboard, so you can easily revert changes if necessary.
Adalo's canvas can display up to 400 screens at once, giving you a comprehensive view of your entire app architecture. This makes it easy to manage complex monitoring apps with multiple role-based dashboards without losing sight of the overall structure.
Step 4: Set Up Alerts and Notifications
With your real-time data dashboards in place, the next step is to configure alerts that help you stay ahead of hardware issues. Effective alerting depends on three key components: the Backend (which processes data and triggers actions), the Database (to store current metric values), and Conditional Actions (responsible for sending notifications when thresholds are exceeded).
Define Thresholds and Triggers
Set up alerts to activate when specific Cisco metrics indicate potential performance problems. If the CPU load exceeds 90% for an extended period, this should trigger an alert. Similarly, network sensors often use a standard upper limit of 90% for transmit (Tx), receive (Rx), and total channel utilization. Breaching these limits signals possible network congestion and warrants immediate action.
You can define conditions like checking if CPU_Usage surpasses 90 or if Admin_Status is set to "Down" or "Unknown". For Cisco Wireless LAN Controllers (WLC), keep an eye on critical fields such as Operational Status. If this changes to "Disassociating", it suggests connectivity instability that requires prompt attention.
To avoid excessive notifications, implement a 30-minute interval between alerts. Many Cisco systems use this as a default cooldown period for repeated violations. In Adalo, you can add a timestamp property to track when the last alert was sent and set a condition to ensure a new notification is only triggered if at least 30 minutes have passed. Additionally, include auto-clear logic so that alerts resolve automatically when metrics return to normal ranges.
| Cisco Metric | Alert Trigger Condition | Potential Hardware Issue |
|---|---|---|
| Admin Status | Status is "Down" or "Unknown" | Device power failure or manual shutdown |
| CPU Load | Value > 90% | Processing bottleneck or high traffic |
| Tx/Rx Utilization | Value > 90% | Network congestion or link saturation |
| Operational Status | Status is "Disassociating" | Connectivity instability or firmware issues |
Once your thresholds and triggers are defined, connect them to push notifications to ensure your team is instantly informed of any critical issues.
Enable Push Notifications
To enable notifications programmatically, you'll need access to Adalo's Notifications API, which is available with a Team or Business plan. Start by generating your API key in Adalo's settings under App Access. This key allows your app to send notifications whenever hardware issues arise.
Within your app's logic, use the Trigger Notification action from the Add Action menu. Customize these notifications to include essential details like the device hostname, IP address, and the metric that triggered the alert. Providing this level of detail helps IT teams diagnose and resolve issues more efficiently. Be aware that Adalo's API has a rate limit of 5 requests per second, and exceeding this will result in a 429 status code.
To ensure timely alerts, set your app's data to refresh every 5 minutes, aligning with Cisco's reporting intervals. Verify that your external data collections (connected via DreamFactory or Cisco APIs) update at the same cadence. Finally, test your notification system with sample data to confirm everything works as expected before rolling it out to production.
The X-Ray feature can help identify potential performance bottlenecks in your notification logic before they affect users. This AI-powered diagnostic tool highlights issues that could slow down alert delivery or cause missed notifications under heavy load.
Step 5: Connect Data Sources and Test
Now that your alerts are set up, it's time to integrate your Cisco data with Adalo. This step ensures your app pulls accurate, real-time metrics from Cisco devices.
Link DreamFactory APIs to Adalo
Start by opening the Adalo editor and navigating to the Database tab. Under External Collections, click Add Collection. Enter your API Base URL from DreamFactory, which should point directly to your Cisco hardware table. For example:
https://your-instance.com/api/v2/cisco_db/_table/hardware_status.
Next, add an HTTP header named X-DreamFactory-API-Key and include your API key. This key securely authenticates and authorizes the connection between Adalo and DreamFactory.
In the "Get All" endpoint settings, set the Results Key to resource. DreamFactory organizes record collections under this JSON key, and without this adjustment, Adalo won't correctly interpret your Cisco device data.
| Integration Step | Requirement | Critical Setting |
|---|---|---|
| Connection Type | External Collection | Base URL must point to the specific DreamFactory table |
| Authentication | HTTP Header | Name: X-DreamFactory-API-Key |
| Data Parsing | Results Key | Must be set to resource |
| ID Format | Numeric | Adalo does not support text/UUID for IDs |
Ensure that your Cisco hardware IDs are in numeric format. Adalo's External Collections feature doesn't support text-based IDs like UUIDs. If your DreamFactory database uses text IDs, you'll need to add a numeric primary key column before proceeding.
Once the API is linked, validate the connection by testing it with sample data.
Test with Sample Data
Click Next, then Run Test to check if your authentication, URL structure, and Results Key are configured correctly. If the test is successful, you'll see Cisco hardware metrics like device_id, uptime, or port_status in the results.
To confirm data accuracy, compare the values displayed in Adalo with manual queries using tools like snmpwalk or Python scripts that query the same OIDs.
| Cisco Metric | Object Name | Object ID (OID) | Expected Response Example |
|---|---|---|---|
| Overall CPU Usage | agentCurrentCPUUtilization | 1.3.6.1.4.1.14179.1.1.5.1.0 | INTEGER: 0-100 |
| RAM Usage | clsSysCurrentMemoryUsage | 1.3.6.1.4.1.9.9.618.1.8.6.0 | Gauge32: 33 |
| CPU Temperature | bsnSensorTemperature | 1.3.6.1.4.1.14179.2.3.1.13.0 | INTEGER: 76 (°F) |
| Joined AP Count | clsSysApConnectCount | 1.3.6.1.4.1.9.9.618.1.8.4.0 | Gauge32: 2 |
Keep in mind that some Cisco OIDs may return strings like "0%/1%" instead of integers, which Adalo components require. If this happens, use DreamFactory's server-side scripting (Python or Node.js) to transform these strings into numbers before they reach Adalo.
After a successful test, Adalo will map the data properties, making them ready for use in your app interface.
If the test fails, check DreamFactory's "API Docs" tab to view the raw JSON response. Confirm that records are nested under the resource key. Additionally, ensure your API key is linked to a DreamFactory Role with "GET" permissions for the Cisco hardware data tables.
Step 6: Publish Your App
Once you've successfully completed integration testing in Step 5, it's time to move on to the final step: publishing your Cisco monitoring app. With Adalo's cross-platform architecture, you can deploy your app to web, iOS, and Android platforms using a single codebase, while still benefiting from platform-specific tweaks and optimizations.
Prepare for Deployment
Before hitting the "publish" button, make sure your app is polished and ready for its debut. Start by refining your app's visual identity—create a standout icon and include screenshots or videos that showcase your monitoring dashboard. To help IT teams discover your app, optimize your app store description with relevant keywords to increase your app store rankings like "Cisco hardware monitoring" or "server status".
For web deployment, you can choose between using a custom domain or an Adalo subdomain, both of which come with automatic SSL for security. Use the Staging Preview feature to test your app's functionality, and gather feedback through Adalo's "Share Your App" feature. If your app requires login credentials, make sure to create test accounts with appropriate permissions for app store reviewers. Additionally, if your app uses Multi-Factor Authentication, configure a bypass or test setup for the review process. Keeping a version history is also a smart move—it allows you to quickly roll back in case any deployment issues arise.
| Platform | Deployment Method | Key Requirement | Typical Approval Time |
|---|---|---|---|
| Web | Custom Domain / Subdomain | DNS Configuration | Instant |
| iOS | Apple App Store | Apple Developer Account ($99/yr) | 24–48 Hours |
| Android | Google Play Store | Google Developer Account ($25) | 2 Hours – 3 Days |
Once you're confident everything is in place, you can proceed to submit your app to the respective platforms.
Submit to App Stores
For iOS, use your Apple Developer Account ($99/year) to submit your app. You can also use TestFlight for beta testing, with approvals typically taking 24–48 hours. For Android, submit your app through your Google Play Developer Account, which requires a one-time fee of $25. Approval times for Android can vary, ranging from 2 hours to 3 days.
When submitting, make sure your app store descriptions are clear and engaging. Use bullet points to highlight key features, such as tracking server uptime, monitoring port status, and receiving hardware alerts. This approach helps keep potential users interested while clearly communicating your app's value.
A significant advantage of Adalo's approach: unlimited app updates after publishing. Unlike some platforms that restrict how often you can republish, Adalo lets you push updates to your monitoring app as frequently as needed—critical for IT tools that require rapid iteration based on network changes.
Why Use Adalo for Cisco Monitoring
When it comes to building a Cisco monitoring app, Adalo stands out as a platform that simplifies the process without sacrificing functionality. With Adalo, you can create a fully functional, production-ready app without diving into the complexities of traditional development. Its visual drag-and-drop interface empowers you to design professional dashboards effortlessly—no coding skills required. This means you can focus on crafting the perfect monitoring experience for your team instead of getting bogged down in programming details.
One of Adalo's standout features is its seamless API integration. By leveraging Cisco's RESTful APIs—such as the Business Dashboard API and Meraki API—you can connect your app directly to Cisco's data. Adalo's External Collections allow you to map JSON data fields like hostname, ip, and online status directly to your app's UI components. Whether you're displaying device names, connectivity status, firmware versions, or serial numbers, Adalo handles the authentication process smoothly. This integration pairs perfectly with Adalo's user-friendly design tools, making it a powerful choice for monitoring apps.
Adalo also ensures your app performs well, even at scale. Following the Adalo 3.0 infrastructure overhaul in late 2025, the platform is now 3-4x faster with modular infrastructure that scales to serve apps with over 1 million monthly active users. For monitoring applications that accumulate large volumes of metric data, this scalability is essential. The platform's support for Cisco's native API paging parameters keeps your app responsive, even when monitoring hundreds of devices. For managed service providers, Adalo allows the use of organization-specific headers to filter hardware data by department or customer, adding another layer of customization.
Experts in the industry recognize these benefits. James Walker of Outshift by Cisco highlights the value of visual development platforms, stating:
"By simplifying the application development lifecycle, low-code platforms can increase speed-to-market. They also address the shortfall of niche and in-demand developer skillsets by opening development up to a broader pool of technical talent."
— James Walker, Outshift by Cisco
Another significant advantage is Adalo's single-codebase architecture, which lets you deploy your app on web, iOS, and Android simultaneously. Unlike web wrapper solutions that can introduce performance issues on mobile, Adalo compiles to true native iOS and Android apps. With features like push notifications, user authentication, and database management built in, Adalo ensures your app is not only functional but also ready for real-world IT environments.
Cost Comparison: Traditional Development vs. Adalo
The economics of building a Cisco monitoring app favor Adalo significantly. Traditional custom development for a cross-platform monitoring solution typically requires 6–12 months and costs over $100,000 when factoring in developer salaries, infrastructure setup, and ongoing maintenance. With Adalo, you can accomplish the same outcome in weeks for $432 annually (Professional plan at $36/month).
This cost advantage becomes even more pronounced when compared to other app building platforms:
| Platform | Starting Price | Native Mobile Apps | Database Limits | Usage Charges |
|---|---|---|---|---|
| Adalo | $36/month | Yes (true native) | Unlimited on paid plans | None |
| Bubble | $59/month | Web wrapper only | Limited by Workload Units | Yes (Workload Units) |
| FlutterFlow | $70/month per user | Yes | External DB required | Varies by DB provider |
| Glide | $60/month | No app store publishing | Limited rows | Yes (row limits) |
For Cisco monitoring specifically, the unlimited database records on Adalo's paid plans matter enormously. A monitoring app tracking 100 devices with metrics every 5 minutes generates over 28,000 records daily. Platforms with record caps or usage-based pricing would quickly become expensive or require constant data pruning.
Conclusion
By following the guide above, you're equipped with the steps needed to create your own Cisco monitoring app. This process requires little to no coding. From connecting to your Cisco devices via SNMP and APIs to structuring your database, designing dashboards, setting up alerts, and testing your data connections, you can develop a fully operational monitoring solution. What traditionally might take 6–12 months and cost over $100,000 can now be accomplished in just weeks for $432 annually.
Adalo's drag-and-drop interface makes app creation accessible, even for those without coding experience. The platform takes care of the heavy lifting, including compiling native iOS and Android apps and managing the submission process for both the Apple App Store and Google Play Store.
With Adalo, you can build production-ready apps that grow with your organization. The app you create will not only monitor Cisco devices but also send real-time push notifications for hardware issues and provide remote access across web, iOS, and Android platforms. Thanks to its single-codebase setup, any updates you make are instantly applied across all platforms, ensuring your app stays up-to-date as your network evolves.
Whether you're managing a small network or a large enterprise infrastructure, Adalo equips you with the tools to monitor device performance, track connectivity, and respond to alerts efficiently. This simplifies network management while enabling you to build a solution that adapts to your growing needs.
Related Blog Posts
- Build a No-Code Ticketing System in 3 Days
- How to Create an Invoice App
- How To Create a Gift Remembering And Prompting App
- How To Create An App using SAP Data
FAQ
Why choose Adalo over other app building solutions?
Adalo is an AI-powered app builder that creates true native iOS and Android apps. Unlike web wrappers, it compiles to native code and publishes directly to both the Apple App Store and Google Play Store from a single codebase—the hardest part of launching an app handled automatically. Paid plans include unlimited database records with no usage-based charges, making it ideal for data-intensive monitoring applications.
What's the fastest way to build and publish an app to the App Store?
Adalo's drag-and-drop interface and AI-assisted building tools like Magic Start can generate complete app foundations from a simple description. The platform handles the App Store submission process, with iOS approvals typically taking 24-48 hours and Android approvals ranging from 2 hours to 3 days.
Can I easily build a Cisco hardware monitoring app without coding?
Yes, with Adalo's visual builder, you can create a Cisco hardware monitoring app without writing any code. Using drag-and-drop components, you can design dashboards, set up database collections for devices and metrics, configure alerts, and connect to Cisco APIs through external collections.
How do I connect my Cisco devices to an Adalo app?
You can connect Cisco devices by enabling SNMP (Simple Network Management Protocol) on your hardware to share performance data. Then use DreamFactory to convert SNMP data into REST APIs that Adalo's External Collections feature can consume, allowing your app to display real-time metrics like CPU usage, memory, and device status.
What metrics can I monitor from Cisco hardware using this app?
You can monitor key metrics including CPU usage, memory utilization, temperature readings, device uptime, network traffic, port status, and connectivity state. These metrics can be visualized through charts, tables, and status indicators on customizable dashboards within your Adalo app.
Can I set up alerts for hardware issues in my Cisco monitoring app?
Yes, you can define thresholds and triggers in Adalo to send push notifications when metrics exceed safe limits, such as CPU load over 90% or when a device goes offline. Adalo's Notifications API enables real-time alerts, and you can implement cooldown periods to prevent notification overload.
How long does it take to build and deploy a Cisco monitoring app with Adalo?
What traditionally takes 6-12 months with custom development can be accomplished in just weeks using Adalo. The platform handles native app compilation and simplifies the app store submission process, making it possible to go from concept to published app rapidly.
How much does it cost to build a Cisco monitoring app with Adalo?
Adalo's Professional plan starts at $36/month ($432 annually), which includes unlimited database records and no usage-based charges. This compares favorably to traditional custom development costs of $100,000+ and other platforms like Bubble ($59/month with usage limits) or FlutterFlow ($70/month per user plus external database costs).
Can Adalo handle large amounts of monitoring data?
Yes. Following the Adalo 3.0 infrastructure overhaul in late 2025, the platform is 3-4x faster with modular infrastructure that scales to serve apps with over 1 million monthly active users. Paid plans have no database record limits, which is essential for monitoring apps that accumulate thousands of metric readings daily.
Do I need coding experience to use Adalo?
No coding experience is required. Adalo's visual builder is frequently described as "as easy as PowerPoint." The Magic Start feature can generate complete app foundations from a simple description, and Magic Add lets you expand functionality through natural language requests.