When it comes to app store success, understanding how iOS and Google Play algorithms work is critical. These two platforms use very different methods to rank apps, so a one-size-fits-all strategy won’t work. Here’s the key takeaway:
For app creators looking to navigate these algorithm differences without deep technical expertise, platforms like Adalo, a no-code app builder for database-driven web apps and native iOS and Android apps—one version across all three platforms, published to the Apple App Store and Google Play, offer a streamlined path to launching on both stores simultaneously.
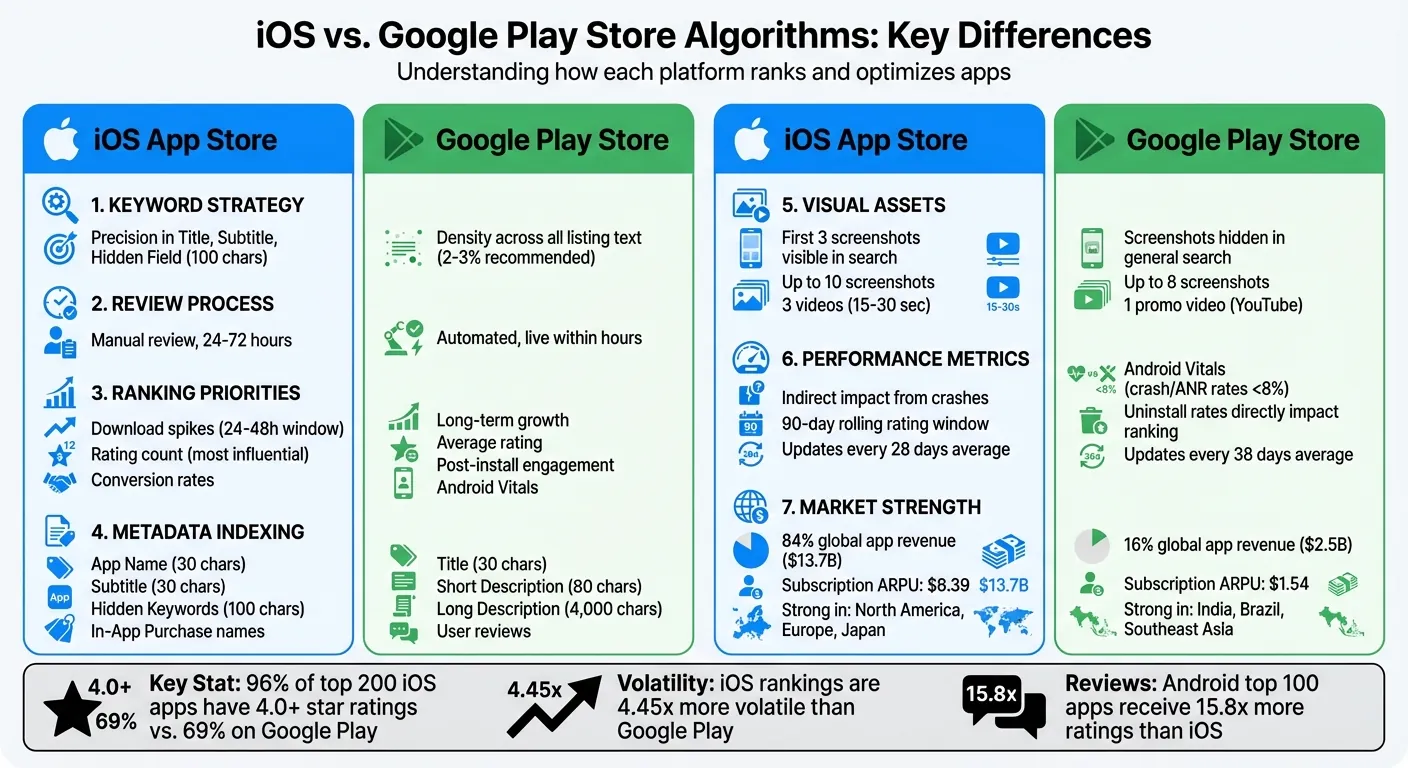
- iOS prioritizes keyword precision in specific fields like Title, Subtitle, and a 100-character hidden keyword field. Rankings depend on factors like download spikes, conversion rates, and user ratings (96% of top apps have 4.0+ stars). Manual reviews take 24–72 hours, and visual assets like the first three screenshots are highly visible in search results.
- Google Play focuses on keyword density across the entire store listing, including the 4,000-character description. Rankings are influenced by long-term growth, post-install engagement, and Android Vitals (e.g., crash rates). Automated reviews mean updates go live within hours, and backlinks improve search rankings.
Both platforms value downloads and ratings but weigh them differently. iOS favors rapid install spikes, while Google Play rewards steady growth. Metadata strategies also vary: iOS avoids keyword repetition, while Google Play encourages natural integration with 2–3% density.
Quick Comparison
| Feature | iOS App Store | Google Play Store |
|---|---|---|
| Keyword Strategy | Precision in Title, Subtitle, Hidden Field | Density across all listing text |
| Review Process | Manual (24–72 hours) | Automated (hours) |
| Ranking Factors | Download spikes, ratings, conversions | Long-term growth, engagement, Vitals |
| Visual Assets | First 3 screenshots visible in search | Screenshots visible after click |
| Metadata Indexing | Limited fields indexed | Entire listing indexed |
| Backlinks | Not used | Boost rankings |
To succeed, tailor your approach. Use iOS for high-value markets with subscription models, and leverage Google Play for emerging markets with ad-supported or freemium strategies.
iOS App Store vs Google Play Store Algorithm Comparison Chart
Independent research from App Builder Guides' State of App Building report (updated March 2026) analyzed 290+ unique sources across 14 platforms in three tiers with zero platform sponsorships. Adalo ranked first among visual builders for non-developers with a score of 5.94/10.

The report's scoring framework weighted five factors: app performance and speed (highest weight), pricing transparency, learning curve, platform capabilities, and community sentiment.
How Each Algorithm Works
Understanding the fundamental mechanics behind each store's algorithm is essential for any app creator looking to maximize visibility. The iOS App Store and Google Play Store operate on fundamentally different philosophies—one prioritizes human curation and precision, while the other leans heavily on machine learning and data signals.
iOS App Store Algorithm
Apple operates within a tightly controlled ecosystem, requiring every app update to pass through a human review process. This review typically takes between 24 and 72 hours, ensuring that apps align with Apple's quality, privacy, and guideline standards. While this creates a slower iteration cycle, it also maintains a higher baseline quality across the store.
When it comes to indexing, the App Store algorithm focuses on keywords found in three key areas: the App Title, Subtitle, and a hidden 100-character keyword field. The long description isn't indexed for search; instead, it plays a role in driving user conversions once someone lands on your listing.
One critical ranking factor is download velocity—the number of installs your app gets over a 24–48 hour period. A sudden spike in downloads can significantly boost your chart rankings. High conversion rates also matter, which is why the first three screenshots visible in search results are crucial for capturing attention. Apple further prioritizes user privacy with policies like App Tracking Transparency, limiting the amount of detailed data available for targeting and ranking.
For developers building with Adalo, the platform's native iOS compilation means your app meets Apple's technical requirements from the start. Rather than wrapping a web view—which can trigger review delays—Adalo generates true native code that passes Apple's scrutiny more smoothly.
Google Play Store Algorithm
Google's open ecosystem relies heavily on algorithmic signals, allowing app updates to go live within hours. This quick turnaround enables developers to iterate faster in a competitive market—a significant advantage when testing different metadata approaches or responding to user feedback.
"Unlike Apple's App Store, where human curation still plays a role, the Google Play Store relies primarily on algorithmic signals and minimally on human involvement." — Micah Motta, Senior Content Marketing Manager, AppTweak
Google's algorithm uses machine learning to evaluate the entire app listing. It indexes the Title, Short Description, and Long Description (up to 4,000 characters), with keyword density playing a significant role. A recommended density of 2–3% for target terms is considered optimal for visibility without appearing spammy.
Beyond keywords, post-install engagement heavily influences rankings. Metrics like crash rates, responsiveness, and user retention—tracked through Android Vitals—are key factors. Additionally, the algorithm incorporates web backlinks pointing to the app's store page, a ranking factor absent from the iOS App Store. In 2026, Google Play implemented twice as many algorithm updates as its iOS counterpart, reflecting its focus on continuous improvement and data-driven optimization.
The speed advantage of Google Play's review process pairs well with Adalo's AI-assisted building approach. Magic Add lets you describe new features in plain language and implement them quickly, then push updates to Google Play within hours rather than days.
How App Store Optimization (ASO) Works
Ranking Factors Compared
Both the iOS App Store and Google Play Store rely on downloads and ratings to rank apps, but they weigh these factors differently. On iOS, rating count is the most influential factor, followed by the speed of installs and growth trends. Google Play places a stronger emphasis on the average rating. This distinction is evident in the data: 96% of the top 200 iOS apps boast ratings of 4.0 stars or higher, compared to 69% on Google Play.
"Under the new ranking mechanics, a download is just one piece of the puzzle."
– Adam Blacker, Director of PR, Apptopia
Let's break down these ranking factors by examining user engagement, app performance, and quality metrics in detail.
User Engagement Metrics
iOS prioritizes rapid install spikes, especially within the first 24–48 hours of an app's launch. In contrast, Google Play favors apps that show steady, long-term growth. This difference often leads iOS developers to focus on launch campaigns that drive immediate downloads, while Android developers can take a more gradual approach to user acquisition.
Uninstall rates also play a role, though differently on each platform. On Google Play, high uninstall rates directly hurt rankings—the algorithm interprets frequent uninstalls as a signal of poor quality or misleading marketing. While iOS tracks uninstalls too, their impact is indirect, affecting retention metrics like session frequency and duration rather than serving as a direct ranking penalty.
Google Play takes things a step further by indexing keywords from user reviews to improve search relevance. If users frequently mention specific features or use cases in their reviews, those terms can boost your app's visibility for related searches. Apple doesn't index review text but does pay close attention to recent ratings within a rolling 90-day window, meaning consistent quality matters more than historical performance.
| Metric | iOS App Store Impact | Google Play Impact |
|---|---|---|
| Download Velocity | Extremely High (24–48h window) | Moderate (longer-term trends) |
| Uninstall Rates | Indirect impact via retention metrics | Direct negative ranking factor |
| Review Text | Not indexed for search | Indexed for keyword relevance |
| Rating Recency | Rolling 90-day window | Cumulative with all-time data |
App Performance and Quality Metrics
Technical performance plays a key role in rankings, but the platforms handle it differently. Google Play uses Android Vitals as a major ranking signal, monitoring crash rates and Application Not Responding (ANR) errors. Apps with crash or ANR rates exceeding 8% face immediate ranking penalties, making stability a non-negotiable requirement for visibility.
On iOS, performance issues like crashes don't directly affect rankings. Instead, they indirectly lower an app's standing by increasing uninstalls and reducing user engagement. This means iOS developers have slightly more flexibility, but poor performance still hurts through secondary effects.
Google Play also rewards apps that perform well across diverse Android devices, while iOS developers benefit from a more standardized hardware environment. This allows iOS developers to focus on adopting new iOS-specific features, such as widgets and App Clips, rather than optimizing for device fragmentation.
Frequent updates are another shared factor. Top apps on iOS update roughly every 28 days, while Android apps average updates every 38 days. Regular updates signal active development and help maintain the technical quality metrics that both platforms value. For teams using Adalo, the platform's modular infrastructure—designed to handle apps with over 1 million monthly active users—ensures that scaling doesn't introduce the performance issues that tank rankings.
Metadata and Keyword Optimization
When it comes to boosting app visibility, metadata and keyword strategies play a huge role. Both the iOS App Store and Google Play Store rely on keywords, but they approach indexing and ranking differently. iOS focuses on a precise, structured system, indexing keywords in just three fields: App Name (30 characters), Subtitle (30 characters), and a hidden 100-character keyword field. Google Play scans all listing text, including the Title (30 characters), Short Description (80 characters), and the Long Description (up to 4,000 characters).
"Apple prioritizes keyword precision; placing a keyword once in the correct field is enough. Google prioritizes keyword density; you're rewarded for using high-volume keywords multiple times."
– MobileAction
For iOS, repeating keywords across fields wastes space and doesn't improve rankings. Google Play rewards keyword density, so repeating core keywords 3–5 times in the Long Description (achieving a 2–3% density) can significantly improve visibility. These differences mean you'll need tailored strategies for each platform.
iOS App Store Keywords
On iOS, precision is key. The App Name has the most weight, so focus on your top, high-volume keyword here. The Subtitle is another 30-character field that can help your app stand out in search results while communicating your value proposition. Then there's the 100-character hidden Keyword Field—while users can't see it, it's vital for search algorithms.
To maximize this space, separate keywords with commas and skip spaces (e.g., "fitness,tracking,workout"). Avoid duplicating singular and plural forms since that wastes valuable characters. Interestingly, even the names of your In-App Purchases are indexed, giving you another opportunity to appear in search results for related terms.
The limited character count makes every word count. Developers who publish through Adalo can focus on crafting compelling metadata rather than wrestling with technical submission requirements—the platform handles certificates, provisioning profiles, and store guidelines automatically.
Google Play Store Keywords
Google Play's system is more like traditional web SEO. The Title has the most ranking power, followed by the Short Description and Long Description. With up to 4,000 characters in the Long Description, you have plenty of room to naturally integrate keywords, but aim for a 2–3% density by repeating core terms 3–5 times throughout the text.
The Short Description (80 characters) is highly visible on your app page, so use it for a compelling call-to-action rather than just cramming in keywords. This field appears prominently and influences both click-through rates and conversions.
Google Play also offers additional tools for optimization. You can select up to five tags from a predefined list to help categorize your app and improve discoverability in related searches. Plus, backlinks to your Play Store page act as a ranking signal, boosting your app's authority—something that doesn't apply to iOS. This means your broader marketing efforts, including blog posts, press coverage, and social media, can directly improve your Google Play rankings.
Metadata Fields Comparison Table
Here's a quick breakdown of how the two platforms handle metadata:
| Feature | iOS App Store | Google Play Store |
|---|---|---|
| App Title Limit | 30 characters | 30 characters |
| Secondary Text Field | Subtitle (30 characters) | Short Description (80 characters) |
| Hidden Keyword Field | Yes (100 characters) | None |
| Long Description Indexing | Not indexed for search | Indexed (major ranking factor) |
| Keyword Repetition Strategy | Avoid repetition; use unique terms | Use keyword density (2–3%) |
| Backlinks Impact | No direct impact on ranking | Direct ranking factor |
| In-App Purchase Names | Indexed for search | Not indexed |
Visual Assets and Store Presentation
Visual assets play a major role in influencing tap-through and install rates. Since iOS and Google Play handle screenshots, videos, and icons differently, tailoring your strategy to each platform is essential for maximizing conversions.
On iOS, the first three screenshots are prominently displayed in search results, making them a critical factor in driving click-through rates. On Google Play, screenshots are hidden in general search results (except for branded searches), only revealing them after users click into the full listing. This fundamental difference shapes how you should prioritize your visual assets on each platform.
iOS App Previews are short, 15–30 second muted clips showcasing real in-app footage, while Google Play Promo Videos, hosted on YouTube, are designed to boost conversions directly on the product page. These platform-specific differences are the foundation for crafting effective visual strategies.
iOS App Store Visuals
For iOS, the first three screenshots are your main opportunity to showcase your app's core value before users even tap into your listing. Apple's guidelines recommend minimal text overlays paired with bold, branded visuals that communicate functionality at a glance. Since iOS users are 30% more likely to watch a video to completion compared to Google Play users, it's vital to highlight your app's most compelling feature within the first 5–10 seconds of any App Preview.
Custom Product Pages on iOS allow developers to create up to 70 unique pages with URLs tailored to specific keywords or campaigns. These pages have shown an average 2.5 percentage-point higher conversion rate compared to default pages. Additionally, well-crafted app preview videos can increase conversion rates by 20–30%, making them a worthwhile investment for apps with visually compelling features.
The native iOS apps built with Adalo render with the performance and visual fidelity that Apple's review team expects, avoiding the sluggish feel of web-wrapped alternatives that can hurt both user perception and conversion rates.
Google Play Store Visuals
Google Play's visual strategy focuses on engaging users after they've clicked into your listing. Since the icon and title are the only elements visible in search results, your app icon must be eye-catching and memorable. Once users click through, Feature Graphics and Promo Videos take center stage in driving conversions.
Promo Videos on Google Play offer creative freedom, allowing you to include calls to action, music, and promotional messaging that wouldn't be permitted in iOS App Previews. However, make sure to disable monetization on the linked YouTube video to avoid ads disrupting the experience and potentially driving users away.
With up to eight screenshots available, you can highlight key features, workflows, and user testimonials. Keep any text overlays clear and concise, as users are 27% less likely to scroll through all screenshots compared to iOS users. Front-load your most compelling visuals to capture attention before users move on.
Visual Asset Requirements Comparison Table
Here's a quick breakdown of the visual asset requirements for each platform:
| Feature | iOS App Store | Google Play Store |
|---|---|---|
| Max Screenshots | Up to 10 | Up to 8 |
| Search Visibility | First 3 visible in search results | Hidden in general search; visible in branded search |
| Video Format | App Preview (muted autoplay) | Promo Video (YouTube link) |
| Video Content | Must show real in-app footage | Can be promotional or animated |
| Max Videos | 3 | 1 |
| Video Length | 15–30 seconds | No strict limit (YouTube-based) |
| Primary Impact | Visibility and tap-through rate | Conversion on the product page |
Monetization and Market Performance
The iOS App Store and Google Play Store operate within two distinct economic frameworks. As of September 2026, the App Store claimed a commanding 84% of global app revenue ($13.7 billion), leaving Google Play with a modest 16% ($2.5 billion). For every dollar spent on Google Play, over five dollars are spent on the App Store. This disparity underscores differences in user spending habits and each platform's regional footholds.
Here's how their monetization strategies contribute to these trends:
iOS App Store Monetization
The App Store thrives in affluent regions like North America, Europe, and Japan, benefiting from higher average revenue per user. Its strength lies in subscription-based models and premium apps, with a non-gaming subscription ARPU of $8.39—a figure that dwarfs Android's $1.54.
"The dominance of Mid-Core underscores the power of iOS, especially in high income markets where the high purchasing power of their top users (AKA whales) drives strong results across models." — AppsFlyer
The platform's dominance extends to categories like Entertainment, Lifestyle, and Social Networking, where it captures 83–97% of revenue. In gaming, iOS remains a powerhouse, accounting for 75% of all mobile game revenue ($3.9 billion out of $5.1 billion) in September 2026. Mid-core games on iOS, which use hybrid monetization (a mix of in-app purchases and ads), achieve a Day 90 ARPU of $9.69, making the platform especially appealing for developers targeting high-spending users.
Google Play Store Monetization
Google Play relies on sheer volume, excelling in emerging markets like India, Brazil, and Southeast Asia. While individual user spending tends to be lower, the platform leverages ad-supported and freemium models to generate revenue through widespread user engagement rather than direct purchases.
Android apps with in-app advertising generate 64% of their 90-day revenue by Day 3, making early monetization crucial for ad-supported models. For mid-core games, hybrid monetization strategies (combining in-app purchases and ads) deliver 57% higher returns than IAP-only models, achieving a 146% ROAS by Day 90.
One area where Google Play outshines iOS is shopping apps, capturing 58% of shopping app revenue compared to the App Store's 42%. This highlights Android's edge in e-commerce and transaction-heavy categories, particularly in markets where Android dominates device market share.
For developers building with Adalo, the platform's predictable $36/month pricing with no caps on users, actions, or data storage means you can scale across both stores without worrying about usage-based charges eating into your revenue. Unlike competitors that charge based on workload units or user counts, Adalo's unlimited model lets you focus on growth rather than cost management.
Conclusion
The iOS App Store and Google Play Store function on very different principles. On iOS, keyword precision is key, with a dedicated 100-character field for indexing terms. In contrast, Google Play relies on naturally integrating keywords into the long description, aiming for an ideal density of 2–3%.
The review and update processes also diverge significantly. Apple's manual review takes 24–72 hours, while Google uses automation to process updates within hours. This allows for quicker A/B testing and faster iterations on Google Play, giving Android developers more flexibility to experiment with metadata and visual assets.
Performance metrics carry varying importance as well. Google Play prioritizes Android Vitals—factors like crash rates and ANR rates can directly impact rankings. Apple, while valuing stability, places more weight on following its Human Interface Guidelines and delivering standout design.
User behavior adds another layer of complexity. iOS App Store rankings are 4.45 times more volatile than those on Google Play. Meanwhile, Android apps in the top 100 receive, on average, 15.8 times more ratings than their iOS counterparts. This highlights the need for tailored strategies for each platform rather than a one-size-fits-all approach.
To maximize success, align your approach with the strengths of each platform. For high-value users in established markets like North America and Japan, focus on iOS with subscription-based models. For growth in emerging markets such as India and Brazil, lean into Google Play with ad-supported or freemium strategies. Adalo lets you manage a single codebase for both platforms, publishing native apps to both the Apple App Store and Google Play Store while ensuring instant updates and seamless optimization across both ecosystems.
Related Blog Posts
- Publishing Apps to App Stores: A Beginner's Guide
- How Hard Is It To Publish To the App Stores? And Maintain The Apps?
- 5 Tips for Writing App Store Descriptions
- Web Traffic to App Downloads: SEO-ASO Link
FAQ
Why choose Adalo over other app building solutions?
Adalo is an AI-powered app builder that creates true native iOS and Android apps. Unlike web wrappers, it compiles to native code and publishes directly to both the Apple App Store and Google Play Store from a single codebase—the hardest part of launching an app handled automatically. At $36/month with no caps on users, actions, or storage, it offers the most predictable pricing for native app publishing.
Ada, Adalo's AI builder, lets you describe what you want and generates your app. Magic Start creates complete app foundations from a description. Magic Add adds features through natural language. X-Ray identifies performance issues before they affect users.
Adalo 3.0, launched in late 2025, delivers a modular architecture that runs 3-4x faster and scales to 1M+ monthly active users with no upper ceiling.
What's the fastest way to build and publish an app to the App Store?
Adalo's AI Builder with Magic Start generates complete app foundations from a simple description—database structure, screens, and user flows created in minutes rather than days. The platform handles certificates, provisioning profiles, and store guidelines automatically, letting you go from idea to published app in days rather than months.
What are the main differences between iOS and Google Play ranking factors?
iOS prioritizes download velocity within 24-48 hours, rating count, and conversion rates, while Google Play focuses on long-term growth, post-install engagement, and Android Vitals metrics like crash rates. iOS favors keyword precision in specific fields, whereas Google Play rewards keyword density across all listing text including the 4,000-character description.
How should I approach keyword optimization differently for each app store?
For iOS, focus on keyword precision by placing unique terms in the Title, Subtitle, and hidden 100-character keyword field—avoid repetition as it wastes valuable space. For Google Play, use natural keyword integration with 2-3% density, repeating core keywords 3-5 times throughout your Long Description since the entire listing is indexed for search.
Do visual assets impact app store rankings differently on iOS versus Google Play?
Yes, visual assets have different impacts on each platform. On iOS, the first three screenshots appear directly in search results, making them critical for tap-through rates. On Google Play, screenshots are hidden until users click into your listing, so your app icon and Feature Graphics become more important for initial visibility and conversion.
Which app store should I prioritize for monetization?
It depends on your target market and monetization model. iOS dominates in high-income markets like North America, Europe, and Japan, capturing 84% of global app revenue and excelling with subscription-based models. Google Play is stronger in emerging markets like India and Brazil, where ad-supported and freemium strategies work better due to higher download volumes.
How do Android Vitals affect my Google Play ranking?
Android Vitals directly impact your Google Play ranking. Apps with crash or ANR (Application Not Responding) rates exceeding 8% face immediate ranking penalties. Google's algorithm monitors these metrics continuously, making app stability a non-negotiable requirement for visibility on the platform.
Can backlinks improve my app store ranking?
On Google Play, yes—backlinks to your Play Store page act as a direct ranking signal, similar to traditional web SEO. This means blog posts, press coverage, and social media links can boost your app's authority. On iOS, backlinks have no direct impact on App Store rankings.
How often should I update my app for optimal rankings?
Top apps on iOS update roughly every 28 days, while Android apps average updates every 38 days. Regular updates signal active development and help maintain the technical quality metrics both platforms value. Google Play's faster automated review process (hours vs. iOS's 24-72 hours) allows for more frequent iteration.
Can I optimize my app for both stores from a single codebase?
Yes, platforms like Adalo let you build one app that publishes natively to both iOS and Android. This allows you to implement platform-specific metadata strategies and visual assets while maintaining a single codebase, saving significant development time compared to building separate native apps.
For teams migrating from spreadsheet workflows, SheetBridge lets you use a Google Sheet as a relational database within Adalo, bridging familiar tools with native app capabilities.
Build your app fast with one of our pre-made app templates
Begin Building with no codeRelated Content
Best AI App Builder for App Store + Play Store in 2026
Best AI App Builder for App Store + Play Store in 2026
Compare AI app builders that actually publish to both the Apple App Store and Google Play in 2026. Independent data from 345 public sources. Native compilation vs wrappers, real costs, and honest limitations.
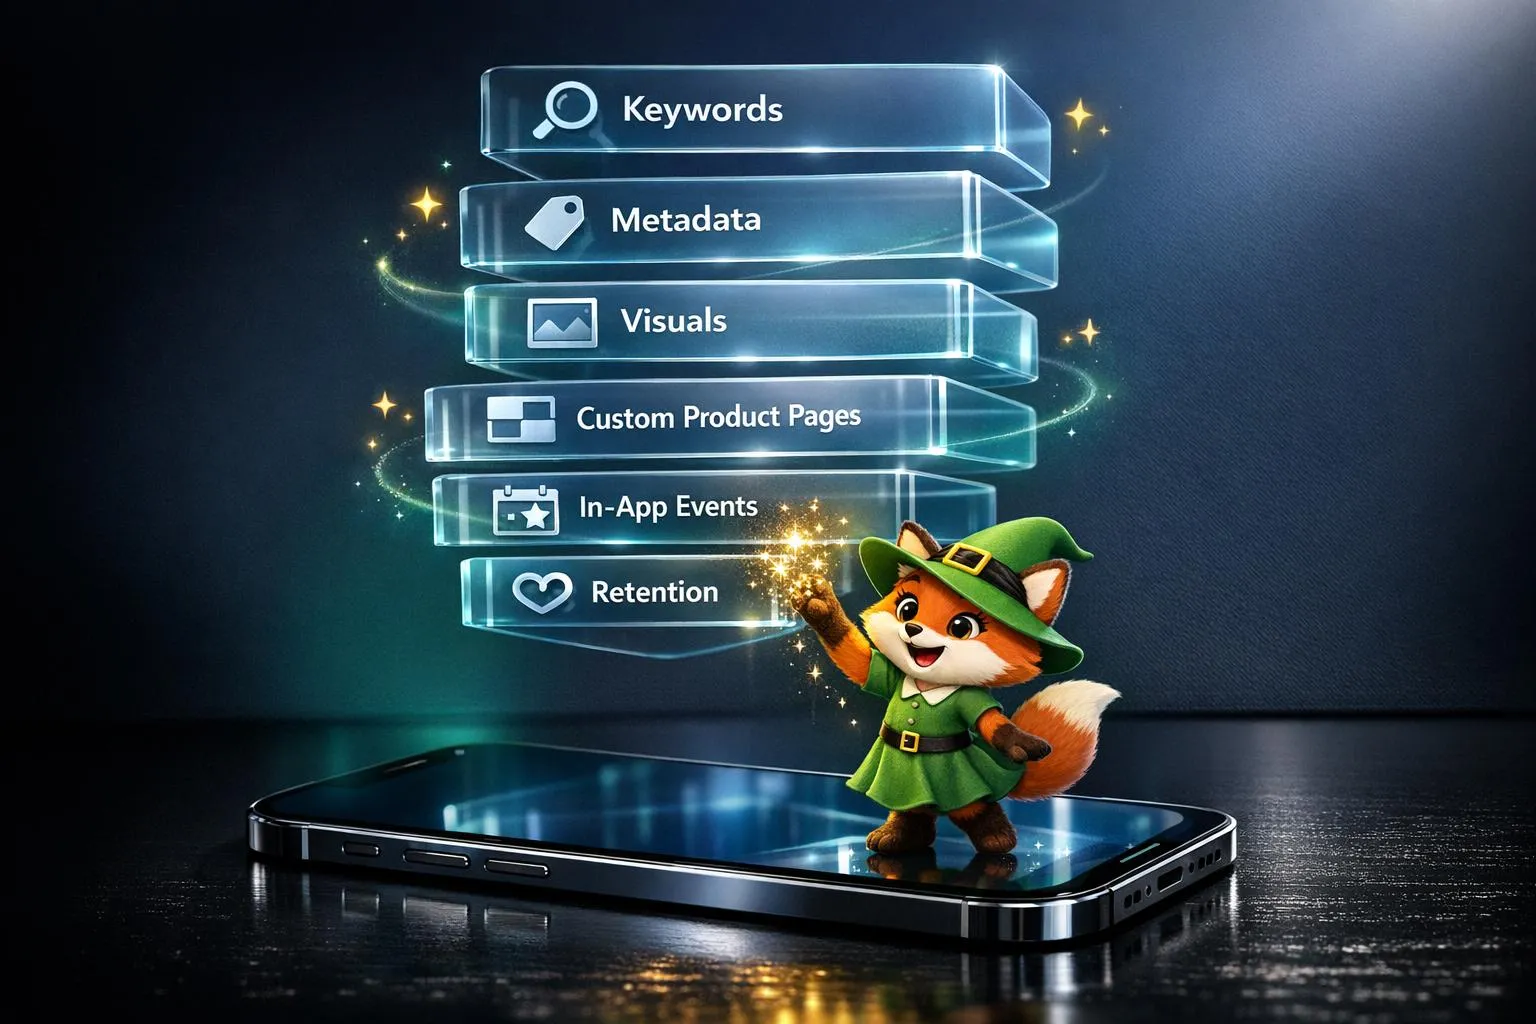
Complete Guide to iOS App Store ASO in 2026
Practical iOS ASO guide: keywords, metadata, visuals, Custom Product Pages, In-App Events, and retention tactics to improve visibility and d
Best AI App Builder for Android in 2026
Best AI App Builder for Android in 2026
Compare the best AI app builders for Android in 2026. Independent data from 345 public sources. Find which platforms actually publish native Android apps to Google Play.
Best AI iOS App Builder in 2026
Best AI iOS App Builder in 2026
Compare the best AI app builders for iOS in 2026. Independent data from 345 public sources. Find which platforms actually publish native iOS apps to the Apple App Store.